2004
Pre-election Polling Analysis
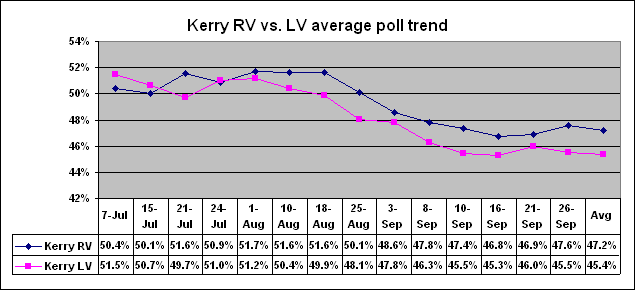
This analysis will
confirm that the 2004 national pre-election registered voter (RV ) polls were closer to the True Vote than likely voter (
Real Clear Politics (RCP)
is the 2004 data source of 133 national polls (102 were
The final 15 RCP polls all
sampled likely voters (
Kerry led the
pre-election polls in August, fell behind in September and rebounded in
October.
When undecided voters
were allocated, Kerry was projected to win.
Kerry did much better in the
unadjusted RV average (45.0-45.1) than in
Kerry did much better in
the adjusted RV projection average (50.1-46.8) than in
Kerry led by 47.3-46.9 in
the Election Model final national 18 poll average.
Kerry led by 50.9-48.1 in
the Election Model final 18 poll projection.
Bush led by 49.0-47.0 in
the RCP final 15
Bush led by 49.8-49.3 in
the RCP final 15
A comparison of RV vs LV polls shows that Kerry did much better in RVs/
There are plausible
reasons for Kerry doing better in the RV polls.
1- RV polls include newly
registered voters.
2. The majority of new
voters (60%) were Democrats.
3- There was a 17 million
net increase in the recorded vote (from 105.4m in 2000 to 122.3m in 2004).
4- Approximately 5m 2000 voters
died prior to 2004 and 5m did not vote (95% turnout).
5- Therefore, we can
estimate that 95m 2000 voters returned to vote in 2004.
6- There were 125.7m
total votes CAST in 2004 (3.4m were uncounted).
7- Therefore, there were
approximately 30m (125.7- 95.4) new voters in 2004.
8- Kerry won
approximately 18m (60%) of new voters; Bush 12m.
The final 15 RCP poll
national average had Bush leading by 49-47%.
The final
Gallup assigned 90% of
undecided voters to Kerry, so the final
Adjusting the RCP/Gallup
average for the undecided vote, we can assume that Kerry and Bush split the 95m
returning (
The race was tied at 47m
with 1m to other (3rd party) voters.
Allocating 60% or 18m of
the new voters to Kerry, he is the winner of the True Vote by 65-59m
(51.8-46.9%).
Is it just a coincidence
that Kerry also had 51.8% in the unadjusted aggregate state exit poll (WPE
method)?
Now let's compare the
True Vote result to the pre-election national polls.
As per
But the
The Election Model
utilized 18 final national polls, of which 9 were RV and 9
After allocating 75% of
undecided voters to Kerry, he led by 50.9-48.1%
Based on the 122.3m
recorded vote, Kerry won by 62.3-58.8m
Kerry's projected share
was just 0.9% below the True Vote share (51.8%) calculated above.
But the projection did
not include the 3.4m uncounted votes (2.74% of 125.7 total votes cast).
Assuming that Kerry won
75% of the uncounted votes, add 2.5m to his total and 0.9m to Bush.
Kerry's margin becomes
64.8-59.7m (51.6- 47.5%), just 0.2% of the True Vote and the unadjusted exit
poll WPE).
When the pre-election
|
|
|
Real Clear Politics -
133 National Polls |
|
|
|
|
|
|
|
|
|
|
|
||||||||||||||||
|
|
|
|
|
|
|
|
|
|
|
||||||||||||||||||
|
|
|
|
|
|
|
|
|
|
|
|
|
|
|
||||||||||||||
|
|
|
|
|
|
|
2-party |
|
|
|
Projected |
|
Final 5 |
Poll MA |
||||||||||||||
|
RCP |
Date |
Kerry |
Bush |
Other |
Spread |
Kerry |
Bush |
Diff |
|
Kerry |
Bush |
Kerry |
Bush |
||||||||||||||
|
133
Poll average |
7/6 - 11/1 |
45.5% |
47.4% |
2.1% |
2.0% |
49.0% |
51.0% |
2.1% |
|
49.26% |
48.63% |
49.47% |
49.51% |
||||||||||||||
|
|
|
|
|
|
|
|
|
|
|
|
|
|
|
||||||||||||||
|
102 |
7/6 - 11/1 |
45.6% |
48.1% |
1.8% |
2.5% |
48.7% |
51.3% |
-2.6% |
|
48.99% |
49.20% |
49.05% |
49.13% |
||||||||||||||
|
31 RV |
7/6 - 9/26 |
45.0% |
45.1% |
3.1% |
0.03% |
50.0% |
50.0% |
-0.0% |
|
50.14% |
46.77% |
50.40% |
46.43% |
||||||||||||||
|
Diff |
|
-0.6% |
-3.0% |
1.3% |
-2.44% |
1.3% |
-1.3% |
2.6% |
|
1.14% |
-2.43% |
1.36% |
-2.69% |
||||||||||||||
|
|
|
|
|
|
|
|
|
|
|
|
|
|
|
||||||||||||||
|
Final
15 (all |
10/22-11/01 |
47.0% |
49.0% |
0.94% |
2.0% |
48.95% |
51.05% |
2.09% |
|
49.29% |
49.77% |
49.47% |
49.51% |
||||||||||||||
|
|
|
|
|
|
|
|
|
|
|
|
|
|
|
||||||||||||||
|
|
|
|
|
|
|
|
|
|
|
|
|
|
|
||||||||||||||
|
Election Model -18
National Polls (9RV, 9LV) |
|
|
|
|
|
|
|
|
|
|
|||||||||||||||||
|
|
|
|
|
|
|
|
|
|
|
|
|||||||||||||||||
|
|
|
|
|
|
|
|
|
|
|
|
|
|
|
||||||||||||||
|
|
|
Sample |
|
Final |
Poll |
2-party |
|
|
|
75% UVA |
Projected |
Final 5-Poll
MA |
|||||||||||||||
|
Election
Model |
Date |
Size |
Poll |
Kerry |
Bush |
Kerry |
Bush |
Diff |
|
Kerry |
Bush |
Kerry |
Bush |
||||||||||||||
|
18
National Polls |
Average |
1720 |
Type |
47.28 |
46.89 |
50.21% |
49.79% |
0.41% |
|
50.90 |
48.10 |
51.25 |
47.75 |
||||||||||||||
|
|
|
|
|
|
|
|
|
|
|
|
|
|
|
||||||||||||||
|
AP |
20-Oct |
976 |
|
49 |
46 |
51.6% |
48.4% |
3.2% |
|
52.0 |
47.0 |
52.0 |
47.0 |
||||||||||||||
|
Time |
21-Oct |
803 |
|
46 |
51 |
47.4% |
52.6% |
-5.2% |
|
47.5 |
51.5 |
49.8 |
49.3 |
||||||||||||||
|
LAT |
24-Oct |
1698 |
RV |
48 |
47 |
50.5% |
49.5% |
1.1% |
|
51.0 |
48.0 |
50.2 |
48.8 |
||||||||||||||
|
ICR |
26-Oct |
817 |
RV |
44 |
46 |
48.9% |
51.1% |
-2.2% |
|
50.8 |
48.3 |
50.3 |
48.7 |
||||||||||||||
|
Nwk |
29-Oct |
1005 |
RV |
45 |
48 |
48.4% |
51.6% |
-3.2% |
|
49.5 |
49.5 |
50.2 |
48.9 |
||||||||||||||
|
Pew |
30-Oct |
2408 |
RV |
46 |
45 |
50.5% |
49.5% |
1.1% |
|
52.0 |
47.0 |
50.2 |
48.9 |
||||||||||||||
|
ARG |
30-Oct |
1258 |
|
49 |
48 |
50.5% |
49.5% |
1.0% |
|
50.5 |
48.5 |
50.8 |
48.3 |
||||||||||||||
|
ABC |
31-Oct |
3511 |
RV |
48 |
47 |
50.5% |
49.5% |
1.1% |
|
51.0 |
48.0 |
50.8 |
48.3 |
||||||||||||||
|
NBC |
31-Oct |
1014 |
|
47 |
48 |
49.5% |
50.5% |
-1.1% |
|
50.0 |
49.0 |
50.6 |
48.4 |
||||||||||||||
|
|
31-Oct |
1866 |
RV |
48 |
46 |
51.1% |
48.9% |
2.1% |
|
51.8 |
47.3 |
51.1 |
48.0 |
||||||||||||||
|
Dem
Corp |
31-Oct |
1018 |
|
48 |
47 |
50.5% |
49.5% |
1.1% |
|
51.0 |
48.0 |
50.9 |
48.2 |
||||||||||||||
|
FOX |
31-Oct |
1400 |
RV |
48 |
45 |
51.6% |
48.4% |
3.2% |
|
52.5 |
46.5 |
51.3 |
47.8 |
||||||||||||||
|
CBS |
1-Nov |
1125 |
RV |
46 |
47 |
49.5% |
50.5% |
-1.1% |
|
50.5 |
48.5 |
51.2 |
47.9 |
||||||||||||||
|
TIPP |
1-Nov |
1284 |
|
44 |
45 |
49.4% |
50.6% |
-1.1% |
|
51.5 |
47.5 |
51.5 |
47.6 |
||||||||||||||
|
Econ |
1-Nov |
2903 |
RV |
49 |
45 |
52.1% |
47.9% |
4.3% |
|
52.8 |
46.3 |
51.7 |
47.4 |
||||||||||||||
|
Marist |
1-Nov |
1166 |
|
49 |
48 |
50.5% |
49.5% |
1.0% |
|
50.5 |
48.5 |
51.6 |
47.5 |
||||||||||||||
|
Zogby |
2-Nov |
1200 |
|
47 |
48 |
49.5% |
50.5% |
-1.1% |
|
50.0 |
49.0 |
51.1 |
48.0 |
||||||||||||||
|
Harris |
2-Nov |
5508 |
|
50 |
47 |
51.5% |
48.5% |
3.1% |
|
51.5 |
47.5 |
51.3 |
47.8 |
||||||||||||||
|
|
|
|
|
|
|
|
|
|
|
|
|
|
|
||||||||||||||
|
|
|
|
|
|
|
|
|
|
|
|
|
|
|
||||||||||||||
|
|
|
|
|
|
|
|
|
|
|
|
|
|
|
||||||||||||||
|
RCP Final 15 |
|
|
|
|
|
|
|
|
|
|
|
|
|||||||||||||||
|
|
|
|
|
|
|
|
|
|
|
|
|
|
|
||||||||||||||
|
|
|
Poll |
|
|
|
2-party |
|
|
|
Projected |
|
Final 5-poll MA |
|
||||||||||||||
|
|
Date |
Kerry |
Bush |
Other |
Spread |
Kerry |
Bush |
Diff |
|
Kerry |
Bush |
Kerry |
Bush |
||||||||||||||
|
Average |
10/22-11/01 |
47.0% |
49.0% |
0.9% |
2.0% |
49.0% |
51.0% |
2.1% |
|
49.29% |
49.77% |
49.47% |
49.51% |
||||||||||||||
|
|
|
|
|
|
|
|
|
|
|
|
|
|
|
||||||||||||||
|
ICR
(741) |
10/22 - 10/26 |
45% |
48% |
2% |
3% |
48.4% |
51.6% |
3.2% |
|
48.8% |
49.3% |
48.6% |
50.0% |
||||||||||||||
|
GW/Battleground
(1000) |
10/25 - 10/28 |
46% |
51% |
0% |
5% |
47.4% |
52.6% |
5.2% |
|
48.3% |
51.8% |
48.9% |
50.1% |
||||||||||||||
|
Newsweek
(882) |
10/27 - 10/29 |
44% |
50% |
1% |
6% |
46.8% |
53.2% |
6.4% |
|
47.8% |
51.3% |
48.5% |
50.5% |
||||||||||||||
|
Pew
Research (1925) |
10/27 - 10/30 |
48% |
51% |
1% |
3% |
48.5% |
51.5% |
3.0% |
|
48.0% |
51.0% |
48.1% |
51.0% |
||||||||||||||
|
CBS/NY
Times (643) |
10/28 - 10/30 |
46% |
49% |
1% |
3% |
48.4% |
51.6% |
3.2% |
|
49.0% |
50.0% |
48.4% |
50.7% |
||||||||||||||
|
ARG
(1258) |
10/28 - 10/30 |
48% |
48% |
1% |
0% |
50.0% |
50.0% |
0.0% |
|
50.3% |
48.8% |
48.7% |
50.6% |
||||||||||||||
|
ABC/Wash
Post (2904)** |
10/28 - 10/31 |
48% |
49% |
0% |
1% |
49.5% |
50.5% |
1.0% |
|
50.3% |
49.8% |
49.1% |
50.2% |
||||||||||||||
|
NBC/WSJ
(1014) |
10/29 - 10/31 |
47% |
48% |
1% |
1% |
49.5% |
50.5% |
1.1% |
|
50.0% |
49.0% |
49.5% |
49.7% |
||||||||||||||
|
CNN/USA/Gallup(1573)* |
10/29 - 10/31 |
49% |
49% |
1% |
0% |
50.0% |
50.0% |
0.0% |
|
49.8% |
49.3% |
49.9% |
49.4% |
||||||||||||||
|
Reuters/Zogby (1208) |
10/29 - 10/31 |
47% |
48% |
1% |
1% |
49.5% |
50.5% |
1.1% |
|
50.0% |
49.0% |
50.1% |
49.2% |
||||||||||||||
|
FOX
News (1200) |
10/30 - 10/31 |
48% |
46% |
1% |
-2% |
51.1% |
48.9% |
-2.1% |
|
51.8% |
47.3% |
50.4% |
48.9% |
||||||||||||||
|
Harris
(1509( |
10/29 - 11/1 |
48% |
49% |
2% |
1% |
49.5% |
50.5% |
1.0% |
|
48.8% |
49.3% |
50.1% |
48.8% |
||||||||||||||
|
CBS
News (939) |
10/29 - 11/1 |
47% |
49% |
1% |
2% |
49.0% |
51.0% |
2.1% |
|
49.3% |
49.8% |
49.9% |
48.9% |
||||||||||||||
|
TIPP
(1041 |
10/30 - 11/1 |
48% |
50% |
1% |
2% |
48.9% |
51.1% |
2.1% |
|
48.6% |
50.3% |
49.7% |
49.1% |
||||||||||||||
|
GW/Battleground
(1000) |
10/31 - 11/1 |
46% |
50% |
0% |
4% |
47.9% |
52.1% |
4.2% |
|
49.0% |
51.0% |
49.5% |
49.5% |
||||||||||||||
|
|
|
|
|
|
|
|
|
|
|
|
|
|
|
||||||||||||||
|
|
|
|
|
|
|
|
|
|
|
|
|
|
|
||||||||||||||
|
RCP Monthy Average |
|
Poll |
|
|
|
|
2-party |
|
|
Projected |
|
Average |
|
||||||||||||||
|
|
Date |
Kerry |
Bush |
Other |
Spread |
Kerry |
Bush |
Diff |
|
Kerry |
Bush |
Kerry |
Bush |
||||||||||||||
|
|
Average |
45.9% |
47.3% |
2.1% |
1.4% |
49.3% |
50.7% |
0.7% |
|
49.41% |
48.48% |
49.63% |
48.21% |
||||||||||||||
|
|
|
|
|
|
|
|
|
|
|
|
|
|
|
||||||||||||||
|
|
July |
46.1% |
44.1% |
3.4% |
-2.0% |
51.1% |
48.9% |
2.2% |
|
50.9% |
45.7% |
50.9% |
45.7% |
||||||||||||||
|
|
Aug |
46.4% |
45.3% |
2.8% |
-1.1% |
50.6% |
49.4% |
1.3% |
|
50.6% |
46.6% |
50.7% |
46.5% |
||||||||||||||
|
|
Sep |
43.4% |
49.2% |
2.0% |
5.8% |
46.9% |
53.1% |
-4.6% |
|
47.5% |
50.5% |
47.6% |
50.3% |
||||||||||||||
|
|
Oct |
46.2% |
48.4% |
1.4% |
2.2% |
48.8% |
51.2% |
2.4% |
|
49.2% |
49.4% |
49.1% |
49.6% |
||||||||||||||
|
|
Nov |
47.3% |
49.5% |
1.0% |
2.3% |
48.8% |
51.2% |
2.4% |
|
48.9% |
50.1% |
49.8% |
49.1% |
||||||||||||||
|
|
|
|
|
|
|
|
|
|
|
|
|
|
|
||||||||||||||
|
|
|
|
|
|
|
|
|
|
|
|
|
|
|
||||||||||||||
|
|
|
|
|
|
|
|
|
|
|
|
|
|
|
||||||||||||||
|
RCP - 102 |
|
|
|
|
2-party |
|
|
|
Projected |
|
5-Poll MA |
|
|||||||||||||||
|
|
Date |
Kerry |
Bush |
Other |
Spread |
Kerry |
Bush |
Diff |
|
Kerry |
Bush |
Kerry |
Bush |
||||||||||||||
|
AVERAGE |
7/6 - 9/26 |
45.62% |
48.07% |
1.80% |
2.46% |
48.70% |
51.30% |
-2.61% |
|
48.99% |
49.20% |
49.47% |
49.51% |
||||||||||||||
|
|
|
|
|
|
|
|
|
|
|
|
|
|
|
||||||||||||||
|
Zogby (1008 |
7/6-7/7 |
47% |
45% |
2% |
-2% |
51.1% |
48.9% |
2.2% |
|
51.5% |
46.5% |
51.5% |
46.5% |
||||||||||||||
|
Time
(774 |
7/6-7/8 |
47% |
45% |
4% |
-2% |
51.1% |
48.9% |
2.2% |
|
50.0% |
46.0% |
50.8% |
46.3% |
||||||||||||||
|
CNN/Gallup/USAT
(706 |
7/8-7/11 |
50% |
45% |
2% |
-5% |
52.6% |
47.4% |
5.3% |
|
52.3% |
45.8% |
51.3% |
46.1% |
||||||||||||||
|
Dem
Corps** (1,010 |
7/10-7/13 |
48% |
45% |
4% |
-3% |
51.6% |
48.4% |
3.2% |
|
50.3% |
45.8% |
51.0% |
46.0% |
||||||||||||||
|
CNN/Gallup/USAT
(709 |
7/19-7/21 |
47% |
46% |
4% |
-1% |
50.5% |
49.5% |
1.1% |
|
49.3% |
46.8% |
50.7% |
46.2% |
||||||||||||||
|
Fox
News (767 |
7/20-7/21 |
44% |
43% |
3% |
-1% |
50.6% |
49.4% |
1.1% |
|
51.5% |
45.5% |
50.7% |
46.0% |
||||||||||||||
|
ABC
News/WP ( |
7/30-8/1 |
49% |
47% |
2% |
-2% |
51.0% |
49.0% |
2.1% |
|
50.5% |
47.5% |
50.8% |
46.3% |
||||||||||||||
|
CNN/Gallup/USAT
( |
7/30-8/1 |
45% |
51% |
2% |
6% |
46.9% |
53.1% |
-6.3% |
|
46.5% |
51.5% |
49.6% |
47.4% |
||||||||||||||
|
Marist
(573 |
7/30-8/2 |
47% |
47% |
1% |
0% |
50.0% |
50.0% |
0.0% |
|
50.8% |
48.3% |
49.7% |
47.9% |
||||||||||||||
|
Fox
News (775 |
8/3 - 8/4 |
47% |
43% |
2% |
-4% |
52.2% |
47.8% |
4.4% |
|
53.0% |
45.0% |
50.5% |
47.6% |
||||||||||||||
|
Dem
Corps**** (1,013 |
8/2 - 8/5 |
49% |
44% |
4% |
-5% |
52.7% |
47.3% |
5.4% |
|
51.3% |
44.8% |
50.4% |
47.4% |
||||||||||||||
|
Time/SRBI
(758 |
8/3 - 8/5 |
48% |
43% |
4% |
-5% |
52.7% |
47.3% |
5.5% |
|
51.8% |
44.3% |
50.7% |
46.8% |
||||||||||||||
|
|
8/9 - 8/11 |
46% |
48% |
3% |
2% |
48.9% |
51.1% |
-2.1% |
|
48.3% |
48.8% |
51.0% |
46.2% |
||||||||||||||
|
Zogby (1,011 |
8/12 - 8/14 |
47% |
43% |
2% |
-4% |
52.2% |
47.8% |
4.4% |
|
53.0% |
45.0% |
51.5% |
45.6% |
||||||||||||||
|
Harris
( |
8/10 - 8/15 |
47% |
47% |
3% |
0% |
50.0% |
50.0% |
0.0% |
|
49.3% |
47.8% |
50.7% |
46.1% |
||||||||||||||
|
Battleground
Poll (1,000 |
8/15 - 8/17 |
44% |
43% |
1% |
-1% |
50.6% |
49.4% |
1.1% |
|
53.0% |
46.0% |
51.1% |
46.4% |
||||||||||||||
|
NPR -
POS/GQR (800 |
8/21 - 8/24 |
47% |
43% |
3% |
-4% |
52.2% |
47.8% |
4.4% |
|
52.3% |
44.8% |
51.2% |
46.5% |
||||||||||||||
|
CNN/USAT/Gallup
(709 |
8/23 - 8/25 |
46% |
48% |
4% |
2% |
48.9% |
51.1% |
-2.1% |
|
47.5% |
48.5% |
51.0% |
46.4% |
||||||||||||||
|
FOX
News (1,000 |
8/24 - 8/25 |
44% |
43% |
3% |
-1% |
50.6% |
49.4% |
1.1% |
|
51.5% |
45.5% |
50.7% |
46.5% |
||||||||||||||
|
Time
(835 |
8/24 - 8/26 |
44% |
46% |
5% |
2% |
48.9% |
51.1% |
-2.2% |
|
47.8% |
47.3% |
50.4% |
46.4% |
||||||||||||||
|
ABC
News/WP (775 |
8/26 - 8/29 |
48% |
48% |
1% |
0% |
50.0% |
50.0% |
0.0% |
|
50.3% |
48.8% |
49.9% |
47.0% |
||||||||||||||
|
ARG
(800 |
8/30 - 9/1 |
47% |
47% |
3% |
0% |
50.0% |
50.0% |
0.0% |
|
49.3% |
47.8% |
49.3% |
47.6% |
||||||||||||||
|
Zogby (1001 |
8/30 - 9/2 |
43% |
46% |
3% |
3% |
48.3% |
51.7% |
-3.4% |
|
49.0% |
48.0% |
49.6% |
47.5% |
||||||||||||||
|
Time
(926 |
8/31 - 9/2 |
41% |
52% |
3% |
11% |
44.1% |
55.9% |
-11.8% |
|
44.0% |
53.0% |
48.1% |
49.0% |
||||||||||||||
|
CNN/USAT/Gallup
(778 |
9/3 - 9/5 |
45% |
52% |
1% |
7% |
46.4% |
53.6% |
-7.2% |
|
46.5% |
52.5% |
47.8% |
50.0% |
||||||||||||||
|
Pew
Research (745 |
9/8 - 9/10 |
38% |
54% |
2% |
16% |
41.3% |
58.7% |
-17.4% |
|
42.5% |
55.5% |
46.3% |
51.4% |
||||||||||||||
|
ABC
News/Wash Post ( |
9/6 - 9/8 |
43% |
52% |
2% |
9% |
45.3% |
54.7% |
-9.5% |
|
45.3% |
52.8% |
45.5% |
52.4% |
||||||||||||||
|
FOX/Opin. Dyn. (1000 |
9/7 - 9/8 |
43% |
47% |
3% |
4% |
47.8% |
52.2% |
-4.4% |
|
48.3% |
48.8% |
45.3% |
52.5% |
||||||||||||||
|
AP/Ipsos (899 |
9/7 - 9/9 |
46% |
51% |
1% |
5% |
47.4% |
52.6% |
-5.2% |
|
47.5% |
51.5% |
46.0% |
52.2% |
||||||||||||||
|
Time
(857 |
9/7 - 9/9 |
41% |
52% |
3% |
11% |
44.1% |
55.9% |
-11.8% |
|
44.0% |
53.0% |
45.5% |
52.3% |
||||||||||||||
|
Zogby (1018 |
9/8 - 9/9 |
42% |
46% |
2% |
4% |
47.7% |
52.3% |
-4.5% |
|
49.5% |
48.5% |
46.9% |
50.9% |
||||||||||||||
|
IBD/TIPP
(674 |
9/7 - 9/12 |
46% |
46% |
3% |
0% |
50.0% |
50.0% |
0.0% |
|
49.8% |
47.3% |
47.8% |
49.8% |
||||||||||||||
|
Harris
(867 |
9/9 - 9/13 |
48% |
47% |
2% |
-1% |
50.5% |
49.5% |
1.1% |
|
50.3% |
47.8% |
48.2% |
49.6% |
||||||||||||||
|
Pew
Research (725 |
9/11 - 9/14 |
46% |
47% |
1% |
1% |
49.5% |
50.5% |
-1.1% |
|
50.5% |
48.5% |
48.8% |
49.0% |
||||||||||||||
|
Battleground
(1000 |
9/12 - 9/15 |
45% |
49% |
1% |
4% |
47.9% |
52.1% |
-4.3% |
|
48.8% |
50.3% |
49.8% |
48.5% |
||||||||||||||
|
CNN/USAT/Gallup
(767 |
9/13 - 9/15 |
40% |
54% |
3% |
14% |
42.6% |
57.4% |
-14.9% |
|
42.3% |
54.8% |
48.3% |
49.7% |
||||||||||||||
|
ARG ( |
9/7 - 9/21 |
46% |
47% |
1% |
1% |
49.5% |
50.5% |
-1.1% |
|
50.5% |
48.5% |
48.5% |
50.0% |
||||||||||||||
|
IBD/TIPP
(650 |
9/14 - 9/18 |
42% |
45% |
2% |
3% |
48.3% |
51.7% |
-3.4% |
|
50.3% |
47.8% |
48.5% |
50.0% |
||||||||||||||
|
Zogby (1066 |
9/17 - 9/19 |
43% |
46% |
1% |
3% |
48.3% |
51.7% |
-3.4% |
|
50.5% |
48.5% |
48.5% |
50.0% |
||||||||||||||
|
NBC
News/WSJ (787 |
9/17 - 9/19 |
46% |
50% |
1% |
4% |
47.9% |
52.1% |
-4.2% |
|
48.3% |
50.8% |
48.4% |
50.1% |
||||||||||||||
|
AP/Ipsos (931 |
9/20 - 9/22 |
45% |
52% |
1% |
7% |
46.4% |
53.6% |
-7.2% |
|
46.5% |
52.5% |
49.2% |
49.6% |
||||||||||||||
|
CBS
News (931 |
9/20 - 9/22 |
42% |
51% |
2% |
9% |
45.2% |
54.8% |
-9.7% |
|
45.8% |
52.3% |
48.3% |
50.4% |
||||||||||||||
|
Marist
(630 |
9/20 - 9/22 |
44% |
50% |
2% |
6% |
46.8% |
53.2% |
-6.4% |
|
47.0% |
51.0% |
47.6% |
51.0% |
||||||||||||||
|
Battleground
(1000 |
9/20 - 9/23 |
45% |
50% |
0% |
5% |
47.4% |
52.6% |
-5.3% |
|
48.8% |
51.3% |
47.3% |
51.6% |
||||||||||||||
|
FOX
News (1000 |
9/21 - 9/22 |
42% |
46% |
1% |
4% |
47.7% |
52.3% |
-4.5% |
|
50.3% |
48.8% |
47.7% |
51.2% |
||||||||||||||
|
Time
(877 |
9/21 - 9/23 |
42% |
48% |
5% |
6% |
46.7% |
53.3% |
-6.7% |
|
45.8% |
49.3% |
47.5% |
50.5% |
||||||||||||||
|
ABC
News/WP (810 |
9/23 - 9/26 |
45% |
51% |
1% |
6% |
46.9% |
53.1% |
-6.3% |
|
47.3% |
51.8% |
47.8% |
50.4% |
||||||||||||||
|
IBD/TIPP
(649 |
9/22 - 9/27 |
45% |
45% |
2% |
0% |
50.0% |
50.0% |
0.0% |
|
51.0% |
47.0% |
48.6% |
49.6% |
||||||||||||||
|
CNN/USAT/Gallup
(758 |
9/24 - 9/26 |
44% |
52% |
3% |
8% |
45.8% |
54.2% |
-8.3% |
|
44.8% |
52.3% |
47.8% |
49.8% |
||||||||||||||
|
LA
Times (1100 |
9/25 - 9/28 |
45% |
51% |
2% |
6% |
46.9% |
53.1% |
-6.3% |
|
46.5% |
51.5% |
47.1% |
50.4% |
||||||||||||||
|
Battleground
(1000 |
9/27 - 9/30 |
44% |
51% |
1% |
7% |
46.3% |
53.7% |
-7.4% |
|
47.0% |
52.0% |
47.3% |
50.9% |
||||||||||||||
|
SHU
Poll Inst. (1003 |
9/27 - 10/2 |
43% |
48% |
2% |
5% |
47.3% |
52.7% |
-5.5% |
|
48.3% |
49.8% |
47.5% |
50.5% |
||||||||||||||
|
Newsweek
(1013 RV) |
9/30 - 10/2 |
47% |
45% |
2% |
-2% |
51.1% |
48.9% |
2.2% |
|
51.5% |
46.5% |
47.6% |
50.4% |
||||||||||||||
|
CNN/USAT/Gallup
(772 |
10/1 - 10/3 |
49% |
49% |
1% |
0% |
50.0% |
50.0% |
0.0% |
|
49.8% |
49.3% |
48.6% |
49.8% |
||||||||||||||
|
Pew
Research (801 |
10/1 - 10/3 |
44% |
49% |
2% |
5% |
47.3% |
52.7% |
-5.4% |
|
47.8% |
50.3% |
48.9% |
49.6% |
||||||||||||||
|
Zogby (1036 |
10/1 - 10/3 |
43% |
46% |
2% |
3% |
48.3% |
51.7% |
-3.4% |
|
49.8% |
48.3% |
49.4% |
48.8% |
||||||||||||||
|
CBS
News/NYT (561 |
10/1 - 10/3 |
47% |
47% |
1% |
0% |
50.0% |
50.0% |
0.0% |
|
50.8% |
48.3% |
49.9% |
48.5% |
||||||||||||||
|
ABC
News/WP (1169 |
10/1 - 10/3 |
46% |
51% |
1% |
5% |
47.4% |
52.6% |
-5.2% |
|
47.5% |
51.5% |
49.1% |
49.5% |
||||||||||||||
|
ARG
(800 |
10/2 - 10/4 |
46% |
46% |
2% |
0% |
50.0% |
50.0% |
0.0% |
|
50.5% |
47.5% |
49.3% |
49.2% |
||||||||||||||
|
ICR
(762 |
10/1 - 10/5 |
45% |
51% |
2% |
6% |
46.9% |
53.1% |
-6.3% |
|
46.5% |
51.5% |
49.0% |
49.4% |
||||||||||||||
|
Fox
News (1000 |
10/3 - 10/4 |
45% |
47% |
1% |
2% |
48.9% |
51.1% |
-2.2% |
|
50.3% |
48.8% |
49.1% |
49.5% |
||||||||||||||
|
Marist
(642 |
10/4 - 10/5 |
46% |
49% |
1% |
3% |
48.4% |
51.6% |
-3.2% |
|
49.0% |
50.0% |
48.8% |
49.9% |
||||||||||||||
|
AP/Ipsos (944 |
10/4 - 10/6 |
50% |
46% |
2% |
-4% |
52.1% |
47.9% |
4.2% |
|
51.5% |
46.5% |
49.6% |
48.9% |
||||||||||||||
|
GW/Battleground
(1250 |
10/3 - 10/7 |
46% |
49% |
0% |
3% |
48.4% |
51.6% |
-3.2% |
|
49.8% |
50.3% |
49.4% |
49.4% |
||||||||||||||
|
Time
(886 |
10/6 - 10/7 |
45% |
46% |
4% |
1% |
49.5% |
50.5% |
-1.1% |
|
48.8% |
47.3% |
49.9% |
48.6% |
||||||||||||||
|
CNN/USAT/Gallup
(793 |
10/9 - 10/10 |
49% |
48% |
1% |
-1% |
50.5% |
49.5% |
1.0% |
|
50.5% |
48.5% |
49.9% |
48.5% |
||||||||||||||
|
ICR
(763 |
10/9 - 10/11 |
43% |
48% |
2% |
5% |
47.3% |
52.7% |
-5.5% |
|
48.3% |
49.8% |
49.8% |
48.5% |
||||||||||||||
|
CBS
News (760 |
10/9 - 10/11 |
45% |
48% |
2% |
3% |
48.4% |
51.6% |
-3.2% |
|
48.8% |
49.3% |
49.2% |
49.0% |
||||||||||||||
|
Zogby (1223 |
10/9 - 10/11 |
45% |
45% |
2% |
0% |
50.0% |
50.0% |
0.0% |
|
51.0% |
47.0% |
49.5% |
48.4% |
||||||||||||||
|
ABC/Wash
Post* (1248 |
10/11 - 10/13 |
48% |
48% |
1% |
0% |
50.0% |
50.0% |
0.0% |
|
50.3% |
48.8% |
49.8% |
48.7% |
||||||||||||||
|
GW/Battleground
(1000 |
10/11 - 10/14 |
46% |
49% |
0% |
3% |
48.4% |
51.6% |
-3.2% |
|
49.8% |
50.3% |
49.6% |
49.0% |
||||||||||||||
|
Newsweek
(880 |
10/14 - 10/15 |
44% |
50% |
1% |
6% |
46.8% |
53.2% |
-6.4% |
|
47.8% |
51.3% |
49.5% |
49.3% |
||||||||||||||
|
Time
(865 |
10/14 - 10/15 |
47% |
48% |
3% |
1% |
49.5% |
50.5% |
-1.1% |
|
48.5% |
48.5% |
49.5% |
49.2% |
||||||||||||||
|
CNN/USAT/Gallup
(788 |
10/14 - 10/16 |
44% |
52% |
1% |
8% |
45.8% |
54.2% |
-8.3% |
|
46.3% |
52.8% |
48.5% |
50.3% |
||||||||||||||
|
CBS/NY
Times (678 |
10/14 - 10/17 |
45% |
47% |
2% |
2% |
48.9% |
51.1% |
-2.2% |
|
49.5% |
48.5% |
48.4% |
50.3% |
||||||||||||||
|
Harris
(820 |
10/14 - 10/17 |
44% |
50% |
1% |
6% |
47.1% |
52.9% |
-5.9% |
|
48.1% |
50.9% |
48.0% |
50.4% |
||||||||||||||
|
NBC/WSJ
( |
10/16 - 10/18 |
48% |
48% |
1% |
0% |
50.0% |
50.0% |
0.0% |
|
50.3% |
48.8% |
48.5% |
49.9% |
||||||||||||||
|
ABC/Wash
Post* (1237 |
10/16 - 10/18 |
46% |
51% |
1% |
5% |
47.4% |
52.6% |
-5.2% |
|
47.5% |
51.5% |
48.3% |
50.5% |
||||||||||||||
|
Pew
Research (1070 |
10/15 - 10/19 |
47% |
47% |
1% |
0% |
50.0% |
50.0% |
0.0% |
|
50.8% |
48.3% |
49.2% |
49.6% |
||||||||||||||
|
FOX
News (1000 |
10/17 - 10/18 |
42% |
49% |
2% |
7% |
46.2% |
53.8% |
-7.7% |
|
47.3% |
50.8% |
48.8% |
50.0% |
||||||||||||||
|
Marist
(772 |
10/17 - 10/19 |
48% |
49% |
1% |
1% |
49.5% |
50.5% |
-1.0% |
|
49.5% |
49.5% |
49.1% |
49.8% |
||||||||||||||
|
AP-Ipsos (976 |
10/18 - 10/20 |
49% |
46% |
2% |
-3% |
51.6% |
48.4% |
3.2% |
|
51.3% |
46.8% |
49.3% |
49.4% |
||||||||||||||
|
GW/Battleground
(1000 |
10/18 - 10/21 |
45% |
49% |
1% |
4% |
47.9% |
52.1% |
-4.3% |
|
48.8% |
50.3% |
49.5% |
49.1% |
||||||||||||||
|
Time
(803 |
10/19 - 10/21 |
46% |
51% |
2% |
5% |
47.4% |
52.6% |
-5.2% |
|
46.8% |
51.3% |
48.7% |
49.7% |
||||||||||||||
|
Newsweek
(880 |
10/21 - 10/22 |
46% |
48% |
1% |
2% |
48.9% |
51.1% |
-2.1% |
|
49.8% |
49.3% |
49.2% |
49.4% |
||||||||||||||
|
|
10/21 - 10/24 |
48% |
48% |
1% |
0% |
50.0% |
50.0% |
0.0% |
|
50.3% |
48.8% |
49.4% |
49.3% |
||||||||||||||
|
CNN/USAT/Gallup
(1195 |
10/22 - 10/24 |
46% |
51% |
1% |
5% |
47.4% |
52.6% |
-5.2% |
|
47.5% |
51.5% |
48.6% |
50.2% |
||||||||||||||
|
ICR
(741 |
10/22 - 10/26 |
45% |
48% |
2% |
3% |
48.4% |
51.6% |
-3.2% |
|
48.75% |
49.25% |
48.6% |
50.0% |
||||||||||||||
|
GW/Battleground
(1000 |
10/25 - 10/28 |
46% |
51% |
0% |
5% |
47.4% |
52.6% |
-5.2% |
|
48.25% |
51.75% |
48.9% |
50.1% |
||||||||||||||
|
Newsweek
(882 |
10/27 - 10/29 |
44% |
50% |
1% |
6% |
46.8% |
53.2% |
-6.4% |
|
47.75% |
51.25% |
48.5% |
50.5% |
||||||||||||||
|
Pew
Research (1925 |
10/27 - 10/30 |
48% |
51% |
1% |
3% |
48.5% |
51.5% |
-3.0% |
|
48.00% |
51.00% |
48.1% |
51.0% |
||||||||||||||
|
CBS/NY
Times (643 |
10/28 - 10/30 |
46% |
49% |
1% |
3% |
48.4% |
51.6% |
-3.2% |
|
49.00% |
50.00% |
48.4% |
50.7% |
||||||||||||||
|
ARG
(1258 |
10/28 - 10/30 |
48% |
48% |
1% |
0% |
50.0% |
50.0% |
0.0% |
|
50.25% |
48.75% |
48.7% |
50.6% |
||||||||||||||
|
ABC/Wash
Post (2904 |
10/28 - 10/31 |
48% |
49% |
0% |
1% |
49.5% |
50.5% |
-1.0% |
|
50.25% |
49.75% |
49.1% |
50.2% |
||||||||||||||
|
NBC/WSJ
(1014 |
10/29 - 10/31 |
47% |
48% |
1% |
1% |
49.5% |
50.5% |
-1.1% |
|
50.00% |
49.00% |
49.5% |
49.7% |
||||||||||||||
|
CNN/USA/Gallup(1573
|
10/29 - 10/31 |
49% |
49% |
1% |
0% |
50.0% |
50.0% |
0.0% |
|
49.75% |
49.25% |
49.9% |
49.4% |
||||||||||||||
|
Reuters/Zogby (1208 |
10/29 - 10/31 |
47% |
48% |
1% |
1% |
49.5% |
50.5% |
-1.1% |
|
50.00% |
49.00% |
50.1% |
49.2% |
||||||||||||||
|
FOX
News (1200 |
10/30 - 10/31 |
48% |
46% |
1% |
-2% |
51.1% |
48.9% |
2.1% |
|
51.75% |
47.25% |
50.4% |
48.9% |
||||||||||||||
|
Harris
(1509 |
10/29 - 11/1 |
48% |
49% |
2% |
1% |
49.5% |
50.5% |
-1.0% |
|
48.75% |
49.25% |
50.1% |
48.8% |
||||||||||||||
|
CBS
News (939 |
10/29 - 11/1 |
47% |
49% |
1% |
2% |
49.0% |
51.0% |
-2.1% |
|
49.25% |
49.75% |
49.9% |
48.9% |
||||||||||||||
|
TIPP
(1041 |
10/30 - 11/1 |
48% |
50% |
1% |
2% |
48.9% |
51.1% |
-2.1% |
|
48.60% |
50.30% |
49.7% |
49.1% |
||||||||||||||
|
GW/Battleground
(1000 |
10/31 - 11/1 |
46% |
50% |
0% |
4% |
47.9% |
52.1% |
-4.2% |
|
49.00% |
51.00% |
49.5% |
49.5% |
||||||||||||||
|
|
|
|
|
|
|
|
|
|
|
|
|
|
|
||||||||||||||
|
|
|
|
|
|
|
|
|
|
|
|
|
|
|
||||||||||||||
|
RCP - 31 RV POLLS |
|
|
|
|
2-party |
|
|
|
Projected |
|
5-Poll MA |
(9/26) |
|
||||||||||||||
|
|
Date |
Kerry |
Bush |
Other |
Spread |
Kerry |
Bush |
Diff |
|
Kerry |
Bush |
Kerry |
Bush |
|
|||||||||||||
|
AVERAGE |
7/6 - 9/26 |
45.03% |
45.06% |
3.10% |
0.03% |
50.00% |
50.00% |
-0.01% |
|
50.14% |
46.77% |
47.60% |
50.20% |
|
|||||||||||||
|
|
|
|
|
|
|
|
|
|
|
|
|
|
|
|
|||||||||||||
|
NBC
News (504 RV) |
7/6 |
49% |
41% |
4% |
-8% |
54.4% |
45.6% |
8.9% |
|
53.5% |
42.5% |
53.5% |
42.5% |
|
|||||||||||||
|
AP/Ipsos (804 RV) |
7/5-7/7 |
45% |
49% |
3% |
4% |
47.9% |
52.1% |
-4.3% |
|
47.3% |
49.8% |
50.4% |
46.1% |
|
|||||||||||||
|
Newsweek
(1,001 RV) |
7/8-7/9 |
47% |
44% |
3% |
-3% |
51.6% |
48.4% |
3.3% |
|
51.5% |
45.5% |
50.8% |
45.9% |
|
|||||||||||||
|
IBD/TIPP
(800 RV) |
7/6-7/10 |
47% |
43% |
4% |
-4% |
52.2% |
47.8% |
4.4% |
|
51.5% |
44.5% |
50.9% |
45.6% |
|
|||||||||||||
|
Wash
Post/ABC (721 RV) |
7/8-7/11 |
46% |
46% |
4% |
0% |
50.0% |
50.0% |
0.0% |
|
49.0% |
47.0% |
50.6% |
45.9% |
|
|||||||||||||
|
CBS/NYT
(823 RV) |
7/11-7/15 |
45% |
42% |
5% |
-3% |
51.7% |
48.3% |
3.4% |
|
51.0% |
44.0% |
50.1% |
46.2% |
|
|||||||||||||
|
Marist
(938 RV) |
7/12-7/15 |
45% |
44% |
2% |
-1% |
50.6% |
49.4% |
1.1% |
|
51.8% |
46.3% |
51.0% |
45.5% |
|
|||||||||||||
|
IBD/TIPP
(842 RV) |
7/12-7/17 |
42% |
40% |
4% |
-2% |
51.2% |
48.8% |
2.4% |
|
52.5% |
43.5% |
51.2% |
45.1% |
|
|||||||||||||
|
Pew
(1,568 RV) |
7/8-7/18 |
46% |
44% |
3% |
-2% |
51.1% |
48.9% |
2.2% |
|
51.3% |
45.8% |
51.1% |
45.3% |
|
|||||||||||||
|
LA
Times (1,529 RV) |
7/17-7/21 |
46% |
44% |
3% |
-2% |
51.1% |
48.9% |
2.2% |
|
51.3% |
45.8% |
51.6% |
45.1% |
|
|||||||||||||
|
NBC/WSJ
(813 RV) |
7/19-7/21 |
45% |
47% |
2% |
2% |
48.9% |
51.1% |
-2.2% |
|
49.5% |
48.5% |
51.3% |
46.0% |
|
|||||||||||||
|
|
7/18-7/22 |
44% |
43% |
4% |
-1% |
50.6% |
49.4% |
1.1% |
|
50.8% |
45.3% |
51.1% |
45.8% |
|
|||||||||||||
|
Time/SRBI
(1000 RV) |
7/20-7/22 |
46% |
43% |
5% |
-3% |
51.7% |
48.3% |
3.4% |
|
50.5% |
44.5% |
50.7% |
46.0% |
|
|||||||||||||
|
IBD/TIPP
(883 RV) |
7/19-7/24 |
44% |
42% |
3% |
-2% |
51.2% |
48.8% |
2.3% |
|
52.3% |
44.8% |
50.9% |
45.8% |
|
|||||||||||||
|
ABC
News/WP (909 RV) |
7/22-7/25 |
46% |
48% |
3% |
2% |
48.9% |
51.1% |
-2.1% |
|
48.3% |
48.8% |
50.3% |
46.4% |
|
|||||||||||||
|
Newsweek
(1,010 RV) |
7/29-7/30 |
49% |
42% |
3% |
-7% |
53.8% |
46.2% |
7.7% |
|
53.5% |
43.5% |
51.1% |
45.4% |
|
|||||||||||||
|
ARG
(776 RV) |
7/30-8/1 |
49% |
45% |
2% |
-4% |
52.1% |
47.9% |
4.3% |
|
52.0% |
46.0% |
51.3% |
45.5% |
|
|||||||||||||
|
CBS
News (991 RV) |
7/31-8/1 |
48% |
43% |
3% |
-5% |
52.7% |
47.3% |
5.5% |
|
52.5% |
44.5% |
51.7% |
45.5% |
|
|||||||||||||
|
IBD/TIPP
(841 RV) |
8/2 - 8/5 |
45% |
42% |
5% |
-3% |
51.7% |
48.3% |
3.4% |
|
51.0% |
44.0% |
51.5% |
45.4% |
|
|||||||||||||
|
AP/Ipsos (798 RV) |
8/3 - 8/5 |
48% |
45% |
3% |
-3% |
51.6% |
48.4% |
3.2% |
|
51.0% |
46.0% |
52.0% |
44.8% |
|
|||||||||||||
|
Pew
(1,166 RV) |
8/5 - 8/10 |
47% |
45% |
2% |
-2% |
51.1% |
48.9% |
2.2% |
|
51.5% |
46.5% |
51.6% |
45.4% |
|
|||||||||||||
|
CBS
News (835 RV) |
8/15 - 8/18 |
46% |
45% |
1% |
-1% |
50.5% |
49.5% |
1.1% |
|
52.0% |
47.0% |
51.6% |
45.6% |
|
|||||||||||||
|
IBD/TIPP
(884 RV) |
8/17 - 8/23 |
43% |
43% |
5% |
0% |
50.0% |
50.0% |
0.0% |
|
49.8% |
45.3% |
51.1% |
45.8% |
|
|||||||||||||
|
LA
Times (1,352 RV) |
8/21 - 8/24 |
44% |
47% |
3% |
3% |
48.4% |
51.6% |
-3.3% |
|
48.5% |
48.5% |
50.6% |
46.7% |
|
|||||||||||||
|
NBC
News/WSJ (806 RV) |
8/23 - 8/25 |
45% |
47% |
3% |
2% |
48.9% |
51.1% |
-2.2% |
|
48.8% |
48.3% |
50.1% |
47.1% |
|
|||||||||||||
|
Newsweek
(1,008 RV) |
9/2 - 9/3 |
41% |
52% |
3% |
11% |
44.1% |
55.9% |
-11.8% |
|
44.0% |
53.0% |
48.6% |
48.4% |
|
|||||||||||||
|
CBS
News (909 RV) |
9/6 - 9/8 |
42% |
49% |
1% |
7% |
46.2% |
53.8% |
-7.7% |
|
48.0% |
51.0% |
47.8% |
49.2% |
|
|||||||||||||
|
Newsweek
(1003 RV) |
9/9 - 9/10 |
43% |
49% |
2% |
6% |
46.7% |
53.3% |
-6.5% |
|
47.5% |
50.5% |
47.4% |
50.3% |
|
|||||||||||||
|
CBS
News (1048 RV) |
9/12 - 9/16 |
41% |
50% |
3% |
9% |
45.1% |
54.9% |
-9.9% |
|
45.5% |
51.5% |
46.8% |
50.9% |
|
|||||||||||||
|
Pew
Research (989 RV) |
9/17 - 9/21 |
42% |
45% |
3% |
3% |
48.3% |
51.7% |
-3.4% |
|
49.5% |
47.5% |
46.9% |
50.7% |
|
|||||||||||||
|
Pew
Research (948 RV) |
9/22 - 9/26 |
40% |
48% |
2% |
8% |
45.5% |
54.5% |
-9.1% |
|
47.5% |
50.5% |
47.6% |
50.2% |
|
|||||||||||||