Confirmation of 2000-2008 Election Fraud: Analysis of the Essential Polling Evidence


TruthIsAll


April 8, 2009


In analyzing historical election data, an ongoing pattern of statistical anomalies leads to two conclusions: the recorded vote does not reflect the True Vote and the pattern always favors the Republicans. This brief summary of recurring anomalies since the 2000 Selection is powerful evidence that the 2000 and 2004 elections were stolen and that landslides were denied in the 2006 midterms and 2008 presidential elections. The analysis does not include millions of potential Democrats who were disenfranchised and never even got to vote.


Uncounted Votes

There are millions of uncounted votes in every election. The majority (70-80%) are Democratic.


Late Votes

The Democratic late vote exceeded the Election Day share by 7% in each of the last three presidential elections.


Undecided voters

Historically, undecided voters break (60-90%) for the challenger.

Pre-election polls in general do not allocate undecided voters.

The undecided vote was strongly Democratic in the last three elections.


New Voters

According to the 1988-2004 National Exit Polls, the Democrats won new voters by an average 14% margin.


Pre-election Polls

Registered voter (RV) polls include all registered new voters; likely-voter (LV) polls are a subset of RV polls and exclude many newly registered.

In general, only LV polls are posted during the final two weeks before the election.

LV polls are a subset of the total (RV) sample and have consistently understated the Democratic vote.

The RV samples are more accurate, especially when there is a heavy turnout of new voters – as in 2004, 2006 and 2008.

The Census reported that 88.5% of registered voters turned out on 2004.

The average projected turnout of 5 final pre-election RV/LV polls was 82.8%.

A regression analysis of Kerry’s vote share vs. registered voter turnout indicated he had a 52.6% share (assuming a 75% UVA).

Assuming the two-party vote, Kerry had a 51.3% share.

There was a strong 0.89 correlation ratio between Kerry’s LV poll share and LV/RV turnout.

In other words, the pre-election polls underestimated voter turnout by 6%. Newly registered Democrats came out in force.


In 2008, Obama won new voters by approximately 71-27%; in 2004, Kerry won new voters by approximately 57-41%.


The calculations below confirm that new voters comprise the difference (RV – LV) between registered (RV) and likely voter (LV) sample-size.

The Obama / McCain share of the difference was 73.3-26.7%, closely matching the 71-27% NEP new voter share.

The Kerry / Bush share of the difference was 57.8-42.2%, closely matching the 57-41% NEP new voter share.


The number of new voters is a function of voter mortality and turnout. It is estimated by the simple formula:

New voters = current election voters– (prior election recorded vote – voter mortality) * prior voter turnout


Applying the new voter formula based on the 2008 recorded vote (131.37m) and the 2004 vote (122.3m),

Given 1.2% annual voter mortality (5.9 million over 4 years) and an estimated 97% turnout of 2004 election voters in 2008:

New 2008 voters = 18.5 million = 131.37 – (122.3 – 5.9)* 0.97 = 131.37 –116.4*.97= 131.37- 112.91

According to the Final 2008 NEP, there were 17.1m new voters (13% of 131.37).


Applying the new voter formula based on 2004 votes cast (125.7m) and 2000 votes cast (110.8m),

New 2004 voters = 23.5 million = 125.7 – (110.8 – 5.4)* 0.97 = 125.74 –105.4*.97= 125.74- 102.24


There were approximately 3.8 million returning Nader voters. Kerry won 2.4 million (64%); Bush had 0.7 million (17%)

According to the 1222am National Exit Poll, Kerry won 13.4 million (57%) new voters; Bush had 9.4 million (41%).

Of the 27.3 million new and returning Nader voters, Kerry won 15.8m and Bush 10.1m – a 5.7 million Kerry margin.

Since Bush won the official recorded vote by 3 million, then 8.7 million more returning Gore voters defected than Bush voters.

But the 1222am National Exit Poll indicated that 10% of returning Bush voters defected to Kerry and 8% of Gore voters defected to Bush.


Final National Exit Poll

The Final NEP is always forced to match the recorded vote count.

In 2004, the returning Bush/Gore 43/37% voter mix was impossible.

In 2006, the returning 49/43% Bush/Kerry voter mix was implausible.

In 2008, the returning 46/37% Bush/Kerry voter mix was impossible.


2000

Gore won by 51.0-50.46m (48.38-47.87%).

The Census reported 110.8 million votes cast, but just 105.4m were recorded.

The Final 2000 NEP was forced to match the recorded vote.

Approximately 4 million of the 5.4 million uncounted votes were for Gore.

Therefore he won the True Vote by 55-52m.

The election was stolen.


2004

Bush won the recorded vote by 62.0-59.0m (50.73-48.27%)

Kerry won the unadjusted state exit polls by 52-47%.

He led the preliminary NEP (12:22am, 13047 respondents) by 51-48%.

He led despite the implausible NEP 41/39% returning Bush/Gore voter mix.


The Final NEP (13660 sample) was forced to match the 50.7-48.3% Bush recorded margin.

To force the match in the Final NEP:

a) Bush shares of returning and new voters were increased,

b) The returning Bush/Gore voter mix was changed to an impossible 43/37%.

The mix indicates an impossible 52.6m (43% of 122.3) returning Bush 2000 voters.


Bush only had 50.46 million recorded votes in 2000.

Approximately 2.5m died and 2.5m did not vote in 2004.

So there were at most 45.5 million returning Bush voters.

The Final overstated the number of returning Bush voters by 7 million.

Kerry won the True Vote by 8-10 million.

The election was stolen.


2006 Midterms

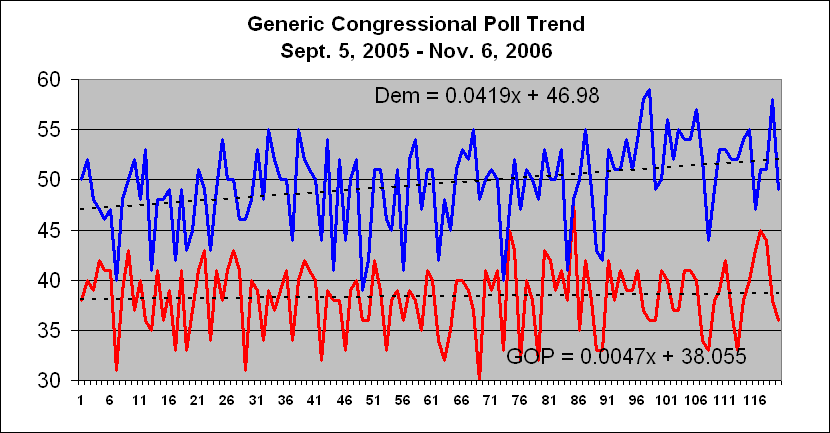
Democrats won all 120 pre-election Generic polls.

The final trend line projection showed a 56.43-41.57% Democratic landslide.

At 7pm, the NEP indicated a 55-43% landslide.

The returning Bush/Kerry voter mix was 47/45%.


The Final was forced to match the 52-46% recorded vote.

To force the match:

a) the Bush share of returning and new voters were increased,

b) the returning voter mix was changed to an impossible 49/43%.

The Democratic margin was cut in half.

The landslide was denied.


2008

Obama won the recorded vote by 69.4-59.9m (52.9-45.6%)

Obama led the final pre-election registered voter polls by 52-39%.

The Final 2008 NEP was forced to match the recorded vote.


The Final indicated that an impossible 5.2 million (4% of 131.37m) were returning third-party voters.

There were only 1.2 million third-party voters in 2004.


To force the match, the Final indicated an impossible 46/37% Bush/Kerry returning voter mix.

The Final indicated there were 60.4 million  (46% of 131.37m) returning Bush voters.

Bush only had 62.0 million votes in 2004 (assuming no fraud).

Approximately 3 million died and another 3 million did not vote in 2008.


The mix overstated the number of returning Bush voters by 4 million - assuming zero fraud in 2004.

It overstated the number of returning Bush voters by 9 million - assuming the unadjusted 2004 state aggregate exit poll (Kerry by 52-47%).

Obama's True Vote margin was cut in half.

The landslide was denied.


In summary:

If Final NEP weightings indicate a mathematically impossible number of returning voters, then simple logic dictates that the weightings are impossible.

Since impossible weightings were necessary to match to the official vote count, then the official vote count must also be impossible.

Since the vote count is impossible, then all demographic category cross tabs must use incorrect weights and/or vote shares to match the count.


Census Voting Statistics


U.S. Census Bureau                                                                                                                                                                                                                                             


Reported Voting in Presidential Election Years by Region, Race, Hispanic Origin, Sex, and Age                                                                                                         

November 1964 to 2004                                                                                                                                                                                                                                        


Presidential elections of                1968           1972              1976              1980              1984              1988              1992              1996              2000              2004


Total voting age                               116.54        136.20           146.55           157.09           169.96           178.10           185.68           193.65           202.61           215.69

Change                                                5.93            19.67             10.35             10.54             12.88             8.14               7.59               7.97               8.96               13.09

Annual Mortality%                               1.38%        1.36%           1.34%           1.32%           1.30%           1.28%           1.26%           1.24%           1.22%           1.20%

4-year mortality                                   6.19            6.43               7.41               7.85               8.29               8.84               9.12               9.36               9.61               9.89

New Voting age                                  12.12          25.86             16.78             17.95             20.73             16.43             16.42             17.09             18.32             22.69


Registered                                        86.57          98.48             97.76             105.04           116.11           118.59           126.58           127.66           129.55           142.07

Change                                                na               11.91             -0.72             7.27               11.07             2.48               7.99               1.08               1.89               12.52

4-year mortality                                   4.78            5.36               5.24               5.55               6.04               6.07               6.38               6.33               6.32               6.82

New Registered (after mort.)              na               17.26             4.52               12.82             17.11             8.55               14.37             7.41               8.21               19.34

Percent                                                                                                                                                                                                                                                                   

Voting age                                           74.3            72.3               66.7               66.9               68.3               66.6               68.2               65.9               63.9               65.9

 Change                                               na               13.8               -0.7               7.4                 10.5               2.1                 6.7                 0.9                 1.5                 9.7


Total votes cast                               78.96          85.77             86.70             93.07             101.88           102.22           113.87           105.02           110.83           125.74

Change                                                2.29            6.80               0.93               6.37               8.81               0.35               11.64             -8.85             5.81               14.91

4-year mortality                                   4.29            4.36               4.67               4.65               4.91               5.30               5.23               5.74               5.21               5.41

Incr votes cast (after mort.)                6.59            11.16             5.60               11.02             13.73             5.64               16.88             -3.11             11.02             20.32

Incr/ votes cast                                8.3%          13.0%           6.5%             11.8%           13.5%           5.5%             14.8%           -3.0%            9.9%             16.2%


Cast/Voting age                                   67.8            63.0               59.2               59.2               59.9               57.4               61.3               54.2               54.7               58.30

Registered VoterTurnout                     91.2            87.1               88.7               88.6               87.7               86.2               90.0               82.3               85.5               88.5

Change in votes cast                          3.0              8.6                 1.1                 7.3                 9.5                 0.3                 11.4               -7.8               5.5                 13.5


Total Recorded Votes                     72.97          76.34             79.98             85.11             92.03             91.60             104.42           96.28             105.42           122.30

Dem                                                     31.28          29.17             40.83             35.48             37.58             41.81             44.91             47.40             51.00             59.03

Rep                                                      31.79          47.17             39.15             43.90             54.46             48.89             39.10             39.20             50.46             62.04

Other                                                   9.91            0.00               0.00               5.72               0.00               0.90               20.41             9.68               3.95               1.23


Uncounted-net                                 6.00            9.43               6.72               7.96               9.85               10.63             9.45               8.74               5.41               3.44

Dem                                                     4.50            7.07               5.04               5.97               7.38               7.97               7.09               6.55               4.06               2.58

Rep                                                      1.50            2.36               1.68               1.99               2.46               2.66               2.36               2.18               1.35               0.86

Net Dem                                               3.00            4.71               3.36               3.98               4.92               5.31               4.72               4.37               2.71               1.72

Percent                                                                                                                                                                                                                                                                   

Uncounted                                           7.60            10.99             7.75               8.55               9.66               10.40             8.30               8.32               4.88               2.74


Total Votes Cast (incl. Unctd)       78.96          85.77             86.70             93.07             101.88           102.22           113.87           105.02           110.83           125.74

Dem                                                     35.77          36.24             45.87             41.45             44.96             49.78             51.99             53.95             55.06             61.61

Rep                                                      33.28          49.53             40.83             45.89             56.92             51.54             41.46             41.38             51.81             62.90

Other                                                   9.91            0.00               0.00               5.72               0.00               0.90               20.41             9.68               3.95               1.23


Adj. Vote Share (incl. Unctd)                                                                                                                                                                                                                               

Dem                                                     45.3%        42.3%           52.9%           44.5%           44.1%           48.7%           45.7%           51.4%           49.7%           49.0%

Rep                                                      42.2%        57.7%           47.1%           49.3%           55.9%           50.4%           36.4%           39.4%           46.8%           50.0%

Other                                                   12.5%        0.0%             0.0%             6.1%             0.0%             0.9%             17.9%           9.2%             3.6%             1.0%

Adj. Dem Margin                                  3.2%           -15.5%          5.8%              -4.8%            -11.7%          -1.7%            9.2%              12.0%            2.9%              -1.0%


Recorded Vote Share                                                                                                                                                                                                                                          

Dem                                                     42.86%      38.21%         51.05%         41.69%         40.83%         45.65%         43.01%         49.23%         48.38%         48.27%

Rep                                                      43.56%      61.79%         48.95%         51.59%         59.17%         53.37%         37.45%         40.71%         47.87%         50.73%

Other                                                   13.58%      0.00%           0.00%           6.72%           0.00%           0.98%           19.54%         10.05%         3.75%           1.00%


Recorded Dem Margin                         -0.70%       -23.58%        2.10%            -9.89%          -18.34%        -7.73%          5.56%            8.52%            0.52%            -2.46%

Dem Reduction in Margin                     3.85%        8.09%           3.71%           5.12%           6.60%           6.00%           3.69%           3.45%           2.42%           1.44%

Exit Poll                                                                                                                                                                                                                                                                   

Dem                                                     45.3%        42.3%           52.9%           44.5%           44.1%           49.8%           45.7%           50.2%           49.4%           52.0%

Rep                                                      42.2%        57.7%           47.1%           49.3%           55.9%           49.7%           33.2%           37.5%           46.2%           47.0%


Percent Voted                                  1968           1972              1976              1980              1984              1988              1992              1996              2000              2004

Race                                                                                                                                                                                                                                                                         

White                                                   69.1            64.5               60.9               60.9               61.4               59.1               63.6               56.0               56.4               60.3

Black                                                    57.6            52.1               48.7               50.5               55.8               51.5               54.0               50.6               53.5               56.3

Hispanic                                               na               37.5               31.8               29.9               32.6               28.8               28.9               26.7               27.5               28.0


Gender                                                                                                                                                                                                                                                                    

Men                                                      69.8            64.1               59.6               59.1               59.0               56.4               60.2               52.8               53.1               56.3

Women                                                66.0            62.0               58.8               59.4               60.8               58.3               62.3               55.5               56.2               60.1


Age                                                                                                                                                                                                                                                                          

18-24                                                   50.4            49.6               42.2               39.9               40.8               36.2               42.8               32.4               32.3               41.9

25-44                                                   66.6            62.7               58.7               58.7               58.4               54.0               58.3               49.2               49.8               52.2

45-64                                                   74.9            70.8               68.7               69.3               69.8               67.9               70.0               64.4               64.1               66.6

65+                                                      65.8            63.5               62.2               65.1               67.7               68.8               70.1               67.0               67.6               68.9


Late Votes


2008         Total   Obama  McCain Other  Obama McCain  Other

Election Day 121.21  63.45  56.13  1.63   52.3%  46.3%  1.4%

Late          10.16  6.01  3.81  0.34   59.2%  37.5%  3.3%


Total        131.37  69.46  59.94  1.97   52.87% 45.62% 1.51%


2004          Total  Kerry  Bush   Other  Kerry  Bush  Other

Election Day  116.7  56.4   59.8   0.40   48.3%  51.3%  0.4%

Late            5.6  2.6   2.2   0.80   46.9%  39.4%  13.7%


Total         122.3  59.0   62.0   1.20   48.27% 50.73% 1.00%


2000          Total  Gore   Bush   Other  Gore   Bush  Other

Election Day  102.6  49.5   49.3   3.8    48.2%  48.1%  3.7%

Late            2.8  1.5   1.2    0.1    53.6%  42.9% 3.5%


Total         105.4  51.00  50.46  3.95   48.38% 47.87% 3.75%


New Voters


According to the 1988-2004 National Exit Polls, the Democrats won new voters by an average 14% margin.


2004

Total      Mix      Votes       Kerry      Votes      Bush       Votes

DNV2k      17%      20.791      57%        11.85      41%        8.52


1st-time   11%      13.453      55%        7.40       43%        5.78

Other      6%       7.338       60.7%      4.45       37.3%      2.74


2004F: 2:04pm Final NEP (13660 respondents)

2004P: 12:22am NEP (13047 respondents)


Percentage of First-time voters

       84   88   92   96   00    2004F   2004P
Dem    38   47   46   54   52    53      55
Rep    61   51   32   34   43    46      43


2000 Voter Mortality


Mortality Table      NEP   Annual Voter  Votes        Final 2000 NEP        Total Voter Deaths

Age    AnnualRate    Age    Rate   Mort.  Cast   Mix    Gore   Bush   Other  Gore   Bush   Other


15-24  0.09%        18-29  0.10%  0.019  18.84  17%    48%    46%    6%     0.036  0.035  0.005

25-45  0.18%        30-44  0.20%  0.064  32.13  29%    48%    49%    3%     0.123  0.126  0.008

45-64  0.71%        45-59  0.60%  0.199  33.24  30%    48%    49%    3%     0.383  0.391  0.024

65+    5.07%        60+    4.00%  1.064  26.59  24%    51%    47%    2%     2.170  2.000  0.085


                     Total  1.22%  1.346  110.8  100%   48.72% 48.01% 3.27%  2.712  2.551  0.121

                                                Total  53.98  53.20  3.62   5.02%  4.80%  3.35%


                     Mort.  Total  Gore   Bush   Other                                   


                     Deaths 5.38   2.71   2.55   0.121                                   

                     4 year 4.88%  50.37% 47.38% 2.25%                                   

                     Annual 1.22%  1.26%  1.20%  0.84%


2008 Undecided Voter Allocation                   


              Final LV Poll        Undecided Voters Allocated       

2008          Obama  McCain Spread Obama  McCain Spread

Gallup        53     42     11     55     44     11

IBD           47.3   42.8   4.5    51.5   44.3   7.2

Zogby         51     44     7      54.1   42.7   11.4

Dem Corp      51     44     7      53     44     9

Ipsos         50     42     8      53     46     7

Pew           49     42     7      52     46     6


Average       50.22  42.80  7.42   53.10  44.50  8.60

                                  50.22  42.80  7.42

Change                     UVA    2.88   1.70   1.18

                                  62.9%  37.1%  25.8%


UVA 83.7% to Obama

Gallup, IBD, Zogby, Dem Corp

                           Proj   53.4   43.8   9.7

                           Poll   50.6   43.2   7.2

                           UVA    2.8    0.5    2.4

                                   83.7%  16.3% 67.4%  


UVA 57.1% to McCain

Ipsos, Pew   

                            Proj   52.5   46.0   6.5

                           Poll   49.5   42.0   7.3

                           UVA    3.0    4.0    -0.8

                                  42.9%  57.1%  -14.2%


2008 Final Pre-election Polls


The Obama / McCain RV-LV share was 73.3-26.7%, closely matching the NEP new voter share (71-27%).


The 1052 difference between the 3-poll RV sample (8581) and the LV subset (7529) comprised 12.3% of the total RV sample.

Assuming 3% of votes cast were uncounted, there were 19.4m newly registered voters and others who did not vote in 2004 (14.3% of 135.43m).


RV       Sample    Obama      McCain   Spread           

Gallup   2824      53         40       13               

ABC      2762      54         41       13               

Pew      2995      50         39       11               


Total    8581      52.27      39.97    12.30            


LV       Sample    Obama      McCain   Spread           

Gallup   2472      53         42       11               

ABC      2470      53         44       9                

Pew      2587      49         42       7                


Total    7529      51.63      42.66    9.0              


RV and LV Samples                                       


Total    7916      RV        7099     LV              

         Obama     McCain     Obama    McCain           

Gallup   1497      1130       1310     1038             

ABC      1491      1132       1309     1087             

Pew      1498      1168       1268     1087             


Total    4486      3430       3887     3212             

Share    52.3%     40.0%      51.6%    42.7%            


         RV-LV     Obama      McCain   Obama    McCain   Spread

Gallup   278       187        91       67.1%    32.9%    34.3%

ABC      228       182        46       80.0%    20.0%    60.0%

Pew      311       230        82       73.8%    26.2%    47.6%


Total    817       599        218      73.3%    26.7%    46.6%

         Final NEP new voters          71%      27%     


RV     Sample Obama  McCain Spread              

Gallup 2824   53     40     13                  

ABC    2762   54     41     13                  

Pew    2995   50     39     11                  


Total  8581   52.3   40.0   12.3


2004 Final Pre-election Polls


The Kerry/Bush vote split of the difference (1335) in sample between the RV and LV subset (57.8–42.2%) matched the 12:22am Preliminary National Exit Poll  'New Voter' shares: 57–41–2%. The 1769 difference — i.e. 5-poll RV samples (10310) exclusive of their LV subsets (8541) — comprised 17.2% of the RV total sample.


In 2004, there were approximately 21.4 million newly registered and other new voters (DNV 2000) — 17% of the 125.74m total votes cast.

Of the 21.4 million, approximately 13.8m (11% of 125.74) were first-time voters. Kerry won 55% of first-timers. The average pre-election poll projected turnout of registered voters was 82.8% (117m of 142m registered). The census reported an 88.5% voter turnout (125.7m). There were 122.3m votes recorded.


                                         0.75   0.25  

                    Actual Poll          Undecided voters allocated   

RV Poll       Sample Kerry  Bush   Spread Kerry  Bush   Spread

11/1   CBS    1125   46     47     -1     50.50  48.50  2.0

10/31  Fox    1400   48     45     3      52.50  46.50  6.0

10/31  Gallup 1866   48     46     2      51.75  47.25  4.5

10/31  ABC    3511   48     47     1      51.00  48.00  3.0

10/30  Pew    2408   46     45     1      52.00  47.00  5.0


Average       2062   47.2   46.0   1.2    51.55  47.45  4.1                                                   


LV Poll       Sample Kerry  Bush   Spread Kerry  Bush   Spread Projected Turnout

11/1   CBS    939    47     49     -2     49.25  49.75  -0.5   83.5%

10/31  Fox    1200   48     46     2      51.75  47.25  4.5    85.7%

10/31  Gallup 1573   49     49     0      49.75  49.25  0.5    84.3%

10/31  ABC    2904   48     49     -1     49.50  49.50  0.0    82.7%

10/30  Pew    1925   48     51     -3     48.00  51.00  -3.0   79.9%


Average       1708   48     48.8   -0.8   49.65  49.35  0.3    82.8%


RV and LV Samples


              9629 RV       8294 LV                   

              Kerry Bush   Kerry Bush          

       CBS    518    529    441    460          

       Fox    672    630    576    552          

       Gallup 896    858    771    771          

       ABC    1685   1650   1394   1423         

       Pew    1108   1084   924    982          


       Total  4878   4751   4106   4188         

              47.3%  46.1%  48.1%  49.0%        


              RV-LV  Kerry  Bush   Kerry% Bush%  Spread

       CBS    145    76     69     52.6%  47.4%  5.2%

       Fox    174    96     78     55.2%  44.8%  10.3%

       Gallup 213    125    88     58.8%  41.2%  17.6%

       ABC    519    291    227    56.2%  43.8%  12.4%

       Pew    286    184    102    64.3%  35.7%  28.7%


       Total  1335   772    563    57.8%  42.2%  15.6%

              NEP 12:22am new      57%    41%


Regression analysis: Kerry Vote share vs. Registered Voter Turnout


Two-party                    75% UVA 

y=.15+.41x                   y=.012+.581x

Kerry    Turnout             Kerry    Turnout

47.8%    80%                 47.7%    80%

48.2%    81%                 48.3%    81%

48.6%    82%                 48.8%    82%

49.0%    83%                 49.4%    83% Pre-election (5-poll) projected turnout

49.4%    84%                 50.0%    84%

49.9%    85%                 50.6%    85%

50.3%    86%                 51.2%    86%

50.7%    87%                 51.7%    87%

51.1%    88%                 52.3%    88%

51.3%    88.5%               52.6%    88.5% Census post-election turnout

51.5%    89%                 52.9%    89%

51.9%    90%                 53.5%    90%


2000 Final Pre-election Polls


                                         0.60   0.40  

                    Actual Poll          Undecided voters allocated   

RV Poll              Gore   Bush   Spread Gore   Bush   Spread

11/2   Newsweek      44     41     3      52.40  46.60  5.80

11/5   Pew           45     41     4      52.80  46.20  6.60

11/5   Gallup        46     44     2      51.40  47.60  3.80


       Total         45     42     3      52.20  46.80  5.40


LV Poll             Gore    Bush   Spread Gore   Bush   Spread

11/2   Newsweek      43     45     -2     49.60  49.40  0.20

11/5   Pew           43     45     -2     49.60  49.40  0.20

11/5   Gallup        45     47     -2     49.20  49.80  -0.60


       Total         43.67  45.67  -2     49.47  49.53  -0.07


2000-2008 Final Pre-election Poll Summary


       RV Polls                          LV Polls           

              Dem    Rep    Spread        Dem    Rep    Spread

       2000   45.00  42.00  3.00          43.67  45.67  -2.00

       2004   47.20  46.00  1.80          47.20  47.00  0.20

       2008   52.33  40.00  12.33         52.00  43.00  9.00


       UVA Projected                                         

       2000   52.20  46.80  5.40          49.47  49.53  -0.07

       2004   51.55  47.45  4.10          49.65  49.35  0.30

       2008   56.96  41.54  15.42         54.63  43.88  10.75


       Recorded                                              

       2000   48.87  48.38  0.49          48.87  48.38  0.49

       2004   48.27  50.73  -2.46         48.27  50.73  -2.46

       2008   52.87  45.62  7.25          52.87  45.62  7.25


       Diff: Proj-Recd                                              

       2000   3.33   -1.58  4.91          0.60   1.15   -0.56

       2004   3.28   -3.28  6.56          1.38   -1.38  2.76

       2008   4.09   -4.08  8.17          1.76   -1.75  3.50


NATIONAL EXIT POLL


11/2/04, 3:59pm 8349 respondents

http://www.scoop.co.nz/stories/pdfs/Mitofsky4zonedata/US2004G_3737_PRES04_NONE_H_Data.pdf


11/2/04, 7:33pm 11027 respondents

http://www.scoop.co.nz/stories/pdfs/Mitofsky4zonedata/US2004G_3798_PRES04_NONE_H_Data.pdf


11/3/04, 12:22am 13047 respondents

http://www.geocities.com/electionmodel/NEP13047.mht


11/3/04, 1:25pm 13660 respondents

http://www.scoop.co.nz/stories/pdfs/Mitofsky4zonedata/US2004G_3970_PRES04_NONE_H_Data.pdf


          2004 PRELIMINARY                  2004 FINAL                 2008 FINAL           
            12:22am (13047)                    2pm (13660)

                                                                    
Voted  Votes  Weight Kerry  Bush   Other         Weight Kerry  Bush   Other  Voted  Weight Obama  McCain Other
2000                                                                       2004

DNV    20.79  17%    57%    41%    2%            17%    54%    45%    1%     DNV    13%    71%    27%    2%
Gore   47.70  39%    91%    8%     1%            37%    90%    10%    0%     Kerry  37%    89%    10%    1%
Bush   50.14  41%    10%    90%    0%            43%    9%     91%    0%     Bush   46%    17%    82%    1%
Other  3.67   3%     64%    17%    19%           3%     71%    21%    8%     Other  4%     66%    24%    10%
                                                                                                      
Share         100%   51.20% 47.50% 1.30%         100%   48.48% 51.11% 0.41%         100.0% 52.62% 45.94% 1.44%
Votes  122.30 122.30 62.62  58.09  1.59          122.30 59.29  62.50  0.50          131.37 69.13  60.35  1.89


2006 Generic Pre-election Poll Trend vs. the 7:07pm and Final National Exit Poll


National Exit Poll

Source      Dem Rep Other

Unadj. NEP  56.4  41.3% 2.3% (Kerry/Bush returning voter share of the 2006 vote: 45.5/46.5%

CNN-7pm     55.2% 43.4% 1.5% (note: Kerry/Bush rounded by NEP to 45/47% 

CNN-Final   52.2% 45.9% 2.5%

NYT         53.1% 44.9% 2.0%


Reported National Vote

Wikipedia   57.7% 41.8% 0.5%

CBS- Nat    52.7% 45.1% 2.2%

CBS-State   51.3% 46.4% 2.3%


120 Pre-election Generic Poll Trend


Dem = 46.98 + .0419x

Rep = 38.06 + .0047x        


Substituting x = 120 and allocating 60% of the undecided vote (UVA) to the Democrats:

          Trend + UVA = Projection

Dem =     52.01 + 4.42   =   56.43%

Rep =     38.62 + 2.95   =   41.57%


National Exit Poll Timeline vs. the True Vote (Generic Poll Trend)


VOTED 2004

          --------- 7:07pm ----------- --------- 11pm Final ---------   ----- True Generic Vote ----- 

        Mix    Dem     Rep     Other   Mix     Dem     Rep     Other   Mix     Dem     Rep     Other

Kerry   45%    93%     6%      1%      43%     92%     7%      1%      49%     93%     6%      1%

Bush    47%    17%     82%     1%      49%     15%     83%     2%      46%     17%     82%     1%

Other   4%     67%     23%     10%     4%      66%     23%     11%     1%      67%     23%     10%

DNV     4%     67%     30%     3%      4%      66%     32%     2%      4%      67%     30%      3%


TOTAL   100%  55.2%  43.4%   1.4%    100%    52.2%   45.9%   1.9%    100%    56.7%   42.1%      1.2%


1988-2008 SUMMARY                                                                                             

Note: preliminary 2008 National Exit Poll data is not available; summary averages are for 1988-2004.                           


                True Vote                   Unadjusted Exit Poll             Recorded Vote          True (D) Recorded Margin Diff

            Dem        Rep        Margin    Dem      Rep      Margin    Dem      Rep      Margin   Margin    ExitP    True

Average     51.68%     42.63%     9.05%     48.82%   44.12%   4.70%     47.90%   45.96%   1.94%    10.86     -3.82%   2.94%


2008        57.2%      41.1%      16.1%     na       na       na        52.9%    45.6%    7.2%     21.82     na       na

2004        52.9%      45.7%      7.2%      52.0%    47.0%    4.9%      48.3%    50.7%    -2.5%    9.10      -7.4%    2.3%

2000        49.1%      46.8%      2.3%      49.4%    46.9%    2.5%      48.4%    47.9%    0.5%     2.52      -2.0%    -0.3%

1996        50.6%      40.5%      10.0%     50.2%    39.8%    10.4%     49.2%    40.7%    8.5%     10.53     -1.9%    -0.4%

1992        50.4%      32.5%      17.9%     45.7%    34.7%    11.0%     43.0%    37.4%    5.6%     20.46     -5.4%    7.0%

1988        49.8%      49.1%      0.7%      46.8%    52.2%    -5.3%     45.6%    53.4%    -7.7%    0.74      -2.4%    6.1%


TRUE VOTE CALCULATION                                                                 
                                                                    
2008                                                               

Vote04 Vote   Mix    Obama  McCain Other         Obama  McCain Other 
DNV    21.7   16.0%  15.42  5.86   0.43          71%    27%    2%    
Kerry  59.1   43.7%  52.63  5.32   1.18          89%    9%     2%    
Bush   53.4   39.5%  9.09   43.82  0.53          17%    82%    1%    
Other  1.1    0.8%   0.75   0.27   0.11          66%    24%    10%   
                                                                    
Total  135.4  100.0% 77.88  55.28  2.27          57.5%  40.8%  1.7%  
Recorded      131.37 69.5  59.9   2.0           52.9%  45.6% 1.5%
      
                                                                    
2004                                                               

Vote00 Vote   Mix    Kerry  Bush   Other         Kerry  Bush   Other 
DNV    23.5   18.7%  13.40  9.64   0.47          57%    41%    2%    
Gore   50.5   40.2%  45.96  4.04   0.51          91%    8%     1%    
Bush   47.9   38.1%  4.79   43.11  0.0           10%    90%    0%    
Other  3.8    3.0%   2.43   0.65   0.72          64%    17%    19%   
                                                                    
Total  125.7  100.0% 66.57  57.47  1.70          52.9%  45.7%  1.4%  
Recorded      122.3  59.0   62.0   1.2           48.3%  50.7%  1.0%


2000                                                       

Vote96 Vote   Mix    Gore   Bush   Other         Gore   Bush   Other 
DNV    16.0   14.4%  8.32   6.88   0.80          52%    43%    5%    
Clinton 48.7  44.0%  41.89  4.38   2.44          86%    9%     5%    
Dole   37.0   33.4%  2.59   33.27  1.11          7%     90%    3%    
Other  9.1    8.2%   2.47   6.48   0.18          27%    71%    2%    
                                                                    
Total  110.8  100.0% 55.26  51.02  4.53          49.9%  46.0%  4.1%
Recorded      105.42 51.0   50.5   4.0           48.4%  47.9% 3.7%
                                                             

1996                                                 

Vote92 Vote   Mix    Clinton Dole  Perot         Clinton Dole  Perot
DNV    8.1    7.7%   4.35   2.74   0.97          54%    34%    12%
Clinton 44.6  42.5%  37.90  4.01   2.68          85%    9%     6%
Bush   35.2   33.6%  4.58   28.54  2.11          13%    81%    6%
Other  17.1   16.3%  7.70   5.99   3.42          45%    35%    20%
                                                             
Total  105.0  100.0% 54.53  41.29  9.18          51.9%  39.3%  8.7%
Recorded      97.87  47.4   41.3   9.2           49.2%  40.7% 10.1%
                                                             

1992                                                        

Vote88 Vote   Mix    Clinton Bush  Perot         Clinton Bush  Perot
DNV    21.0   18.4%  9.67   6.72   4.62          46%    32%    22%
Dukakis45.3   39.7%  37.62  2.27   5.44          83%    5%     12%
Bush   46.9   41.1%  7.04   30.51  9.39          15%    65%    20%
Other  0.8    0.7%   0.41   0.41   0.00          50%    50%    0%
                                                             
Total  114.1  100.0% 54.74  39.91  19.45         48.0%  35.0%  17.0%
Recorded      104.42 44.9   39.1   20.4          43.0%  37.5% 19.5%
                                                             

1988

Vote84 Vote   Mix    Dukakis Bush  Other         Dukakis Bush  Other
DNV    11.4   11.1%  5.35   5.81   0.23          47%    51%    2%
Mondale38.8   37.9%  35.66  2.71   0.39          92%    7%     1%
Reagan 52.0   50.9%  9.89   41.64  0.52          19%    80%    1%
                                                             
Total  102.2  100.0% 50.90  50.16  1.14          49.8%  49.1%  1.1%
Recorded      91.60  41.8   48.9   0.91          45.6%  53.4%  1.0%  


2004 TRUE VOTE

                                                        2004                Calculated Vote                       

2000    Recorded   Uncounted   Cast       Deaths       Alive      Turnout  Voted    Weight    Kerry     Bush     Other

DNV                                                                         25.62     20.4%     57%       41%      2%

Gore    51.00      4.04        55.04      2.69         52.36      95%      49.74    39.6%     91%       8%       1%

Bush    50.46      1.18        51.64      2.52         49.12      95%      46.67    37.1%     10%       90%      0%

Other   3.95       0.16        4.11       0.20         3.91       95%      3.72     2.96%     64%       17%      19%


Total   105.42     5.38        110.80     5.41         105.39     100.1    125.74   100%      53.21%    45.42%   1.36%

                                                                   Cast             125.74      66.91     57.11    1.72


                                                                                   Recorded     48.27%    50.73%   1.00%

                                                                                      122.30     59.03     62.04    1.23


2008 TRUE VOTE

                                                        2008                Calculated Vote                       

2004    Exit Poll   Uncounted   Cast       Deaths       Alive      Turnout  Voted    Weight    Obama     McCain   Other

DNV                                                                         21.71     16.0%     71%       27%      2%

Kerry   63.59      1.79        65.38      3.14         62.25      95%      59.13    43.7%     89%       9%       2%

Bush    57.47      1.62        59.09      2.84         56.26      95%      53.44    39.5%     17%       82%      1%

Other   1.23       0.03        1.26       0.06         1.20       95%      1.14     0.84%     66%       24%      10%


Total   122.30     3.45        125.74     6.04         119.70     113.7    135.43   100%      57.51%    40.82%   1.67%

                                                                   Cast             135.43      77.88     55.28    2.27


                                                                                 Recorded       52.87%    45.62%   1.51%

                                                                                      131.37     69.46     59.93    1.98


NATIONAL EXIT POLL

              2004 PRELIMINARY                     2004 FINAL                            2008 FINAL          
              12:22am (13047)                       (13660)
      

CATEGORY      Kerry  Bush   Other                Kerry  Bush   Other                      Obama  McCain Other
Average       50.85% 47.88% 1.27%                47.95% 51.08% 0.97%                      52.69% 45.57% 1.74%
Total Votes   62.19  58.55  1.55                 58.64  62.47  1.19                       69.22  59.86  2.29
Max           51.63% 48.51% 1.85%                48.62% 51.62% 1.46%                      53.13% 46.14% 2.24%
Min           50.08% 47.24% 0.69%                47.29% 50.54% 0.48%                      52.25% 44.99% 1.25%
                                                                                                      
Gender        50.78% 48.22% 1.00%                47.78% 51.22% 1.00%                      52.71% 45.35% 1.94%
Party-ID      51.07% 47.85% 1.08%                47.89% 51.22% 0.89%                      52.67% 45.14% 2.19%
Voted 2000    51.20% 47.50% 1.30%                48.48% 51.11% 0.41%                      52.62% 45.94% 1.44%
Region        50.53% 47.95% 1.52%                48.24% 51.08% 0.68%                      52.76% 45.56% 1.68%
Education     50.43% 48.18% 1.39%                47.82% 51.24% 0.94%                      52.31% 45.93% 1.76%
                                                                                                      
Race          50.98% 47.61% 1.41%                47.81% 50.99% 1.20%                      52.82% 45.57% 1.61%
Age           50.26% 47.69% 2.05%                47.96% 51.28% 0.76%                      52.29% 45.71% 2.00%
Income        51.07% 47.75% 1.18%                48.13% 51.02% 0.85%                      52.96% 44.99% 2.05%
Ideology      50.18% 48.60% 1.22%                47.25% 51.54% 1.21%                      52.56% 45.88% 1.56%
Religion      50.78% 48.01% 1.21%                47.99% 50.94% 1.07%                      53.07% 45.58% 1.35%
                                                                                                      
Military      51.20% 47.62% 1.18%                48.38% 50.44% 1.18%                      52.65% 45.50% 1.85%
Decided       51.23% 47.93% 0.84%                47.50% 51.22% 1.28%                      52.67% 45.81% 1.52%
Location      51.40% 47.47% 1.13%                48.14% 50.73% 1.13%                      52.88% 45.41% 1.71%


              2004 PRELIMINARY                     2004 FINAL                            2008 FINAL          
              12:22am (13047)                        (13660)
                                                                                        
GENDER

        Mix   Kerry  Bush   Other         Mix    Kerry  Bush   Other                Mix    Obama  McCain Other
Male   46.0%  47%    52%    1%            46%    44%    55%    1%                   46%    49%    48%    3%
Fem    54.0%  54%    45%    1%            54%    51%    48%    1%                   54%    56%    43%    1%
                                                                                                      
Share  100%   50.78% 48.22% 1.00%         100%   47.78% 51.22% 1.00%                100%   52.71% 45.35% 1.94%
Votes  122.30 62.10  58.97  1.22          122.30 58.43  62.64  1.22                 131.37 69.25  59.58  2.55


PARTY ID                                 Change in mix: Dem -1%; Rep +2%; Ind -1%                                         


        Mix   Kerry  Bush   Other         Mix    Kerry  Bush   Other                Mix    Obama  McCain Other

Dem    38%    91%    9%     0%            37%    89%    11%    0%                   39%    89%    10%    1%
Rep    35%    7%     93%    0%            37%    6%     93%    1%                   31%    9%     89%    2%
Ind    27%    52%    44%    4%            26%    49%    49%    2%                   30%    52%    44%    4%
                                                                                                      
Share  100%   51.07% 47.85% 1.08%         100%   47.89% 51.22% 0.89%                100%   52.67% 45.14% 2.19%
Votes  122.30 62.46  58.52  1.32          122.30 58.57  62.64  1.09                 131.37 69.19  59.30  2.88


              2004 PRELIMINARY                     2004 FINAL                            2008 FINAL          
              12:22am (13047)                        (13660)

VOTED IN 2000                             Change in mix: Gore -2%+ Bush +2%

        Mix   Kerry  Bush   Other         Mix    Kerry  Bush   Other                Mix    Obama  McCain Other

DNV    17%    57%    41%    2%            17%    54%    45%    1%            DNV    13%    71%    27%    2%
Gore   39%    91%    8%     1%            37%    90%    10%    0%            Kerry  37%    89%    10%    1%
Bush   41%    10%    90%    0%            43%    9%     91%    0%            Bush   46%    17%    82%    1%
Other  3%     64%    17%    19%           3%     71%    21%    8%            Other  4%     66%    24%    10%
                                                                                                      
Share  100%   51.20% 47.50% 1.30%         100%   48.48% 51.11% 0.41%                100.0% 52.62% 45.94% 1.44%
Votes  122.30 62.62  58.09  1.59          122.30 59.29  62.50  0.50                 131.37 69.13  60.35  1.89


REGION                                   Change in mix: South +1%;  West -1%      <                

        Mix   Kerry  Bush   Other         Mix    Kerry  Bush   Other                Mix    Obama  McCain Other

East   22%    58%    41%    1%            22%    56%    43%    1%                   22%    59%    40%    1%
Midw   26%    50%    49%    1%            26%    48%    51%    1%                   24%    54%    44%    2%
South  31%    44%    54%    2%            32%    42%    58%    0%                   32%    46%    53%    1%
West   21%    53%    45%    2%            20%    50%    49%    1%                   22%    55%    42%    3%
                                                                                                      
Share  100%   50.53% 47.95% 1.52%         100%   48.24% 51.08% 0.68%                100%   52.76% 45.56% 1.68%
Votes  122.30 61.80  58.64  1.86          122.30 59.00  62.47  0.83                 131.37 69.31  59.85  2.21


EDUCATION                            Change in mix: Some college +1%; Post Grad -1%

        Mix   Kerry  Bush   Other         Mix    Kerry  Bush   Other                Mix    Obama  McCain Other

NoHS   4%     53%    46%    1%            4%     50%    49%    1%                   4%     63%    36%    1%
HSG    22%    50%    48%    2%            22%    47%    52%    1%                   20%    52%    47%    1%
Col    31%    48%    51%    1%            32%    46%    54%    0%                   31%    51%    47%    2%
ColG   26%    49%    50%    1%            26%    46%    52%    2%                   28%    49%    49%    2%
PostG  17%    57%    41%    2%            16%    55%    44%    1%                   17%    58%    40%    2%
                                                                                                      
Share  100%   50.43% 48.18% 1.39%         100%   47.82% 51.24% 0.94%                100%   52.31% 45.93% 1.76%
Votes  122.30 61.67  58.92  1.70          122.30 58.48  62.66  1.15                 131.37 68.72  60.34  2.31
                                                                                                      
                                                                                                      
              2004 PRELIMINARY                     2004 FINAL                            2008 FINAL          
              12:22am (13047)                         (13660)
                                                                                                      
RACE AND GENDER     

        Mix   Kerry  Bush   Other         Mix    Kerry  Bush   Other                Mix    Obama  McCain Other
WMale  36%    40%    59%    1%            36%    37%    62%    1%                   36%    41%    57%    2%
WFem   41%    47%    51%    2%            41%    44%    55%    1%                   39%    46%    53%    1%
NwMale 10%    73%    26%    1%            10%    67%    30%    3%                   11%    76%    22%    2%
NwFem  13%    77%    22%    1%            13%    75%    24%    1%                   14%    84%    14%    2%
                                                                                                      
Share  100%   50.98% 47.61% 1.41%         100%   47.81% 50.99% 1.20%                100%   52.82% 45.57% 1.61%
Votes  122.30 62.35  58.22  1.72          122.30 58.47  62.36  1.47                 131.37 69.39  59.87  2.12


AGE

        Mix   Kerry  Bush   Other         Mix    Kerry  Bush   Other                Mix    Obama  McCain Other
18-29 17%    56%    42%    2%            17%    54%    45%    1%                   18%    66%    32%    2%
30-44 29%    48%    49%    3%            29%    46%    53%    1%                   29%    52%    46%    2%
45-59 30%    51%    47%    2%            30%    48%    51%    1%                   37%    49%    49%    2%
60+    24%    48%    51%    1%            24%    46%    54%    0%                   16%    45%    53%    2%
                                                                                                      
Share  100%   50.26% 47.69% 2.05%         100%   47.96% 51.28% 0.76%                100%   52.29% 45.71% 2.00%
Votes  122.30 61.47  58.32  2.51          122.30 58.65  62.71  0.93                 131.37 68.69  60.05  2.63


INCOME                                   Change in mix: 0-15 -1%; 75-100 +1%

        Mix   Kerry  Bush   Other         Mix    Kerry  Bush   Other                Mix    Obama  McCain Other
0-15K 9%     65%    34%    1%            8%     63%    36%    1%                   6%     73%    25%    2%
15-30 15%    60%    39%    1%            15%    57%    42%    1%                   12%    60%    37%    3%
30-50 22%    53%    46%    1%            22%    50%    49%    1%                   19%    55%    43%    2%
50-75 23%    46%    53%    1%            23%    43%    56%    1%                   22%    48%    49%    3%
75-100 13%    48%    51%    1%            14%    45%    55%    0%                   15%    51%    48%    1%
100-150 11%   43%    55%    2%            11%    42%    57%    1%                   14%    48%    51%    1%
150-200 4%    43%    55%    2%            4%     42%    58%    0%                   6%     48%    50%    2%
200+    3%    43%    55%    2%            3%     35%    63%    2%                   6%     52%    46%    2%
                                                                                                      
Share  100%   51.07% 47.75% 1.18%         100%   48.13% 51.02% 0.85%                100%   52.96% 44.99% 2.05%
Votes  122.30 62.46  58.40  1.44          122.30 58.86  62.39  1.04                 131.37 69.57  59.10  2.69


              2004 PRELIMINARY                     2004 FINAL                            2008 FINAL          
              12:22am (13047)                         (13660)


IDEOLOGY                                 Change in mix: Lib -1%; Con +1%

       Mix    Kerry  Bush   Other         Mix    Kerry  Bush   Other                Mix    Obama  McCain Other
Lib    22%    86%    12%    2%            21%    85%    13%    2%                   22%    88%    10%    2%
Mod    45%    57%    42%    1%            45%    54%    45%    1%                   44%    60%    39%    1%
Con    33%    17%    82%    1%            34%    15%    84%    1%                   34%    20%    78%    2%
                                                                                                      
Share  100%   50.18% 48.60% 1.22%         100%   47.25% 51.54% 1.21%                100%   52.56% 45.88% 1.56%
Votes  122.30 61.37  59.44  1.49          122.30 57.78  63.03  1.48                 131.37 69.05  60.27  2.05


RELIGION

        Mix   Kerry  Bush   Other         Mix    Kerry  Bush   Other                Mix    Obama  McCain Other
Prot   53%    43%    56%    1%            53%    40%    59%    1%                   54%    45%    54%    1%
Cath   27%    50%    49%    1%            27%    47%    52%    1%                   27%    54%    45%    1%
Jewish 3%     78%    22%    0%            3%     74%    25%    1%                   2%     78%    21%    1%
Other 7%     75%    22%    3%            7%     74%    24%    2%                   6%     73%    22%    5%
None   10%    69%    29%    2%            10%    67%    32%    1%                   11%    75%    23%    2%
                                                                                                      
Share  100%   50.78% 48.01% 1.21%         Total 47.99% 50.94% 1.07%                100%   53.07% 45.58% 1.35%
Votes  122.30 62.10  58.71  1.48          122.30 58.69  62.30  1.31                 131.37 69.72  59.88  1.77


MILITARY

        Mix   Kerry  Bush   Other         Mix    Kerry  Bush   Other                Mix    Obama  McCain Other
Yes    18%    43%    55%    2%            18%    41%    57%    2%                   18%    45%    54%    1%
No     82%    53%    46%    1%            82%    50%    49%    1%                   82%    54%    44%    2%
                                                                                                      
Share  100%   51.20% 47.62% 1.18%         100%   48.38% 50.44% 1.18%                100%   52.65% 45.50% 1.85%
Votes  122.30 62.62  58.24  1.44          122.30 59.17  61.69  1.44                 131.37 69.17  59.77  2.43
                                                                                        
                                                                                                      
              2004 PRELIMINARY                     2004 FINAL                            2008 FINAL          
              12:22am (13047)                        (13660)
                                                                                                      
                                                                                                      
WHEN DECIDED                             Change in mix: Today -1%; Last3 +1%

        Mix   Kerry  Bush   Other         Mix    Kerry  Bush   Other                Mix    Obama  McCain Other
Today 6%     53%    40%    7%            5%     52%    45%    3%                   4%     50%    45%    5%
3days 3%     53%    41%    6%            4%     55%    42%    3%                   3%     46%    52%    2%
7days 2%     48%    50%    2%            2%     48%    51%    1%                   3%     48%    50%    2%
30days 10%    60%    38%    2%            10%    54%    44%    2%                   15%    54%    43%    3%
Over30 79%    50%    50%    0%            79%    46%    53%    1%                   75%    53%    46%    1%
                                                                                                      
Share  100%   51.23% 47.93% 0.84%         100%   47.50% 51.22% 1.28%                100%   52.67% 45.81% 1.52%
Votes  122.30 62.65  58.62  1.03          122.30 58.09  62.64  1.57                 131.37 69.19  60.18  2.00


COMMUNITY

        Mix   Kerry  Bush   Other         Mix    Kerry  Bush   Other                Mix    Obama  McCain Other
BigCity 13%   64%    36%    0%            13%    61%    39%    0%                   12%    64%    35%    1%
SmCity 18%   53%    45%    2%            18%    49%    49%    2%                   18%    63%    35%    2%
Suburbs 45%   50%    49%    1%            45%    47%    52%    1%                   50%    50%    48%    2%
SmTowns 8%    52%    46%    2%            8%     48%    50%    2%                   8%     50%    48%    2%
Rural  16%   43%    56%    1%            16%    40%    59%    1%                   12%    42%    57%    1%
                                                                                                      
Share  100%   51.40% 47.47% 1.13%         100%   48.14% 50.73% 1.13%                100%   52.88% 45.41% 1.71%
Votes                                    122.30 58.87  62.04  1.38                 131.37 69.47  59.66  2.25


Graphics


2008 Election Model: Obama Electoral Vote and Popular Vote Share Trend

http://www.geocities.com/electionmodel/2008ElectionModel_30624_image001.gif


2008 Election Calculator: Obama Vote Margin Sensitivity to share of returning Kerry and Bush voters

http://www.geocities.com/electionmodel/2008ElectionCalculator_21811_image001.gif


2008 Election Calculator: Obama Vote Share Sensitivity to share of returning Kerry and Bush voters

http://www.geocities.com/electionmodel/2008ElectionCalculator_23895_image001.gif


2006 Pre-election Generic Poll Trend

http://www.geocities.com/electionmodel/Election2006_16921_image001.png


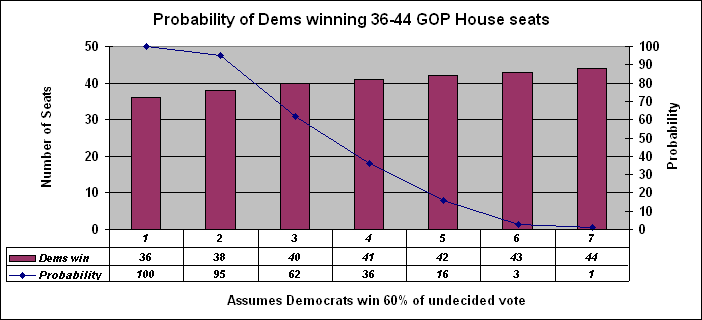
Probabilities of Democratic House Gain

http://www.geocities.com/electionmodel/Election2006_22243_image001.png


2004 Pre-Election and Exit Poll Vote Share Simulation

http://www.geocities.com/electionmodel/InteractiveElectionSimulation_12255_image001.png


Hosted by www.Geocities.ws

1