The Gender Vote: Further Confirmation of a Kerry Landslide
TruthIsAll
According to the Final National Exit Poll (which is always matched to the recorded vote) the two-party gender vote shares in 2000 and 2004 were the following:
2000: Gore won 55.7% of women voters, but only 44.2% of men. Gore won the recorded vote by 51.0-50.46m.
2004: Kerry won 51.5% of women and 44.4% of men. Bush won the recorded vote by 62.0-59.0m.
How come Bush sharply increased his share of Democratic women voters while his share of Republican males declined? One would normally expect to see a positive correlation in the Demographic Trend between the two groups.
Science works by assuming that the explanation which best fits the data is correct. But it must continue to be tested against other data which either strengthens the case or causes it to be rejected in favor of a better explanation.
Kerry's 59m recorded vote was an 8m (15.7%) increase over Gore's 51m. Yet according to the National Exit Poll (13047 respondents, updated at 12:22am), Kerry won 11.3m (58%) of the net 19.5m 2-party increase in new voters from 2000. Therefore, how does one explain the 3.3m discrepancy between Bush's 11.5m (23%) increase in votes and his 8.2m (42%) share of new voters?
So Kerry apparently won by 62.3-58.7m. But he actually did much better than that.
First, there was a net 2% defection of Bush 2000 voters to Kerry. Second, returning Nader voters preferred Kerry by better than 3-1. These factors produce a Kerry 64-57m margin - assuming 122.3m recorded votes (see the “True Vote” calculation below). But approximately 3.4m ballots were uncounted and about 75% were for Kerry. Therefore his true margin was close to 9 million votes (66.6-57.9m).
To believe that Bush won by the 62-59m recorded vote, one must believe that his “mandate” was provided by women who in 2000 either a) did not vote, b) voted for Gore, or c) voted for Nader. But according to the NEP, Kerry won New voters by 57-41%, Gore voters by 91-8% and Nader voters by 64-17%. So why should you believe it?
__________________________________________________________
2000/2004 Gender Vote Shares (2-party)
Gore won 55.7% of females
Kerry won 51.5% of females, a 4.15% decline.
Therefore, 4.15/55.7= 7.45% (net) of female Gore voters switched to Bush.
Gore won 44.2% of males.
Kerry won 44.4% of males, a 0.23% increase.
Therefore, 0.23/55.8= 0.41% (net) of male Bush voters switched to Kerry.
__________________________________________________________
The White Vote
Gore won 49.5% of the White Female vote.
Kerry won 44.4% of the White Female vote (5.04% decline).
Therefore, 5.04/49.5= 10.19% (net) of White Female Gore voters switched to Bush.
Gore won 37.5% of the White Male vote.
Kerry won 38.4% of the White Male vote (0.88% increase).
Therefore, 0.88/62.5= 1.41% (net) of White Male Bush voters switched to Kerry.
__________________________________________________________
The Black Vote
Gore won 94.0% of the Black Female vote.
Kerry won 90.0% of the Black Female vote (4.00% decline).
4.25% (net) of Black Female Gore voters switched to Bush.
Gore won 87.6% of the Black Male vote.
Kerry won 86.9% of the Black Male vote (.76% decline).
0.87% (net) of Black Male Gore voters switched to Bush.
__________________________________________________________
National Exit Poll
Gender demographic
2000 Final
(matched to recorded vote)
Mix Gore Bush Other Nader
Male 48% 42% 53% 1% 3%
Fem 52% 54% 43% 1% 2%
Total 100% 48.3% 47.8% 1.0% 2.5%
Votes 105.4 51.0 50.5 1.1 2.9
2004 Composite 12:22am update
(13047 respondents)
Mix Kerry Bush Other
Male 46% 47% 52% 1%
Female 54% 54% 45% 1%
Total 100% 50.8% 48.2% 1.0%
Votes 122.3 62.1 59.0 1.2
2004 Final -2pm
(13660 respondents; matched to recorded vote)
Mix Kerry Bush Other
Male 46% 44% 55% 1%
Female 54% 51% 48% 1%
Total 100% 47.8% 51.2% 1.0%
Votes 122.3 58.4 62.6 1.2
2004 True Vote
(adjusted to match "Voted 2000" - see below)
Mix Kerry Bush Other
Male 46.4% 49.5% 49.5% 1%
Female 53.6% 55.0% 44.0% 1%
Total 100% 52.4% 46.6% 1.0%
122.3 64.1 57.0 1.2
__________________________________________________________
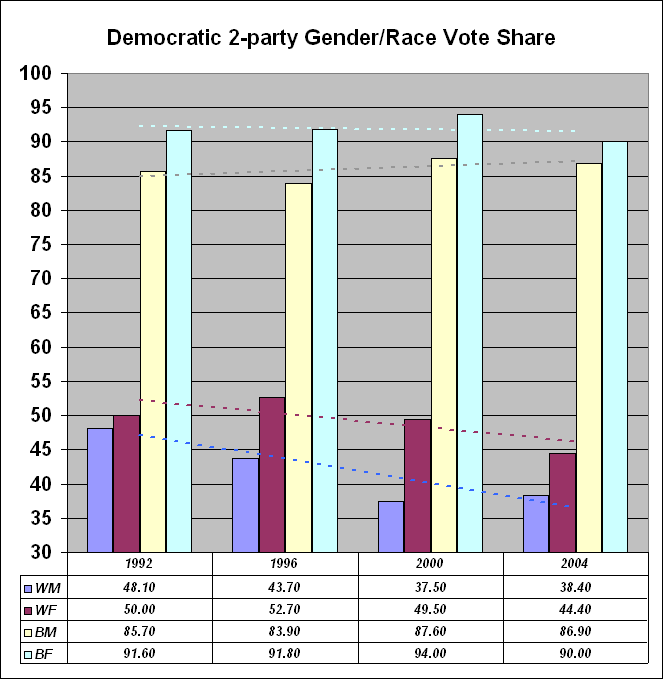
Democratic Gender vote share
trend (2-party)
Year 1992 1996 2000 2004 Change Wtd
Total 53.1 54.4 50.0 48.5 (1.52) (1.52)
Male 51.9 49.4 44.2 44.4 0.23 0.11
Female 54.9 58.7 55.7 51.5 (4.15) (2.24)
Diff 3.0 9.3 11.5 7.1
White
Male 48.1 43.7 37.5 38.4 0.88 0.32
Female 50.0 52.7 49.5 44.4 (5.04) (2.07)
Diff 1.9 9.0 12.0 6.0
Black
Male 85.7 83.9 87.6 86.9 (0.76) (0.04)
Female 91.6 91.8 94.0 90.0 (4.00) (0.28)
Diff 5.9 7.9 6.4 3.1
__________________________________________________________
Composite State Exit Poll
Nov. 3, 12:40am
72,714 respondents
Gender Demographic
Gender Mix Votes Kerry Bush Nader
Female 53.76% 65.7 52.4% 47.0% 0.6%
Male 46.24% 56.5 47.0% 52.0% 1.0%
Votes 122.3 61.5 59.7 0.97
50.3% 48.9% 0.8%
__________________________________________________________
National Exit Poll Timeline
Gender Demographic
NEP Sample Kerry
Update Size Female Male Female Male Share
4:00pm 8349 58% 42% 53% 47% 50.48%
7:33pm 11027 54% 46% 54% 47% 50.78%
12:22am 13047 54% 46% 54% 47% 50.78%
1:25pm 13660 54% 46% 51% 44% 47.78%
(Final NEP matched to recorded vote)
__________________________________________________________
National Exit Poll
Nov.3, 12:22am: 13047 respondents
Voted 2000
Weights adjusted to calculate True Vote based on
2000 recorded vote;
3.5% voter mortality;
98% turnout of 2000 voters
True Vote (adjusted) Actual (before adj)
Voted Mix Kerry Bush Other Mix Kerry Bush Other
No 23.6 19.3% 57% 41% 2% 17% 57% 41% 2%
Gore 48.2 39.4% 91% 8% 1% 39% 91% 8% 1%
Bush 47.7 39.0% 10% 90% 0% 41% 10% 90% 0%
Other 2.8 2.3% 71% 21% 8% 3% 71% 21% 8%
Total 122.3 100% 52.4% 46.6% 1.0% 100% 51.4% 47.6% 1.0%
122.3 64.1 57.0 1.2 122.3 62.9 58.2 1.2
___________________________________________________________________________