Uncounted and Switched Votes
TruthIsAll
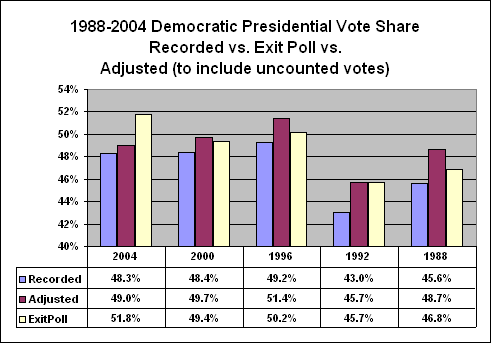
Further Confirmation of a Kerry Landslide
1988-2004: Uncounted
Votes and Exit Poll Discrepancies
Uncounted votes
have steadily declined as percent of total votes cast - from 10.4% in 1988 to
2.7% in 2004. When uncounted votes are included in order to derive total votes
cast for the five elections from 1988-2004, the adjusted Democratic vote is
within 0.1% of the unadjusted exit poll share.
Comparing the adjusted vote to the aggregate state
exit polls and the recorded vote:
(2-party exit
poll in parenthesis)
Year Democrat Recorded Exit Poll Adjusted
Average 46.9 48.8 (52.7) 48.9
1988
Dukakis 45.6 46.8 (47.3) 48.7
1992
Clinton 43.0 45.7 (56.8) 45.7
1996
Clinton 49.2 50.2 (55.8) 51.4
2000
Gore 48.4 49.4 (51.4) 49.7
2004 Kerry 48.3 51.8 (52.3) 49.0
Look at this graph. In every one of the
last five elections the unadjusted Democratic exit poll share exceeded the
recorded vote. But which of the five elections stands out from the rest?
Only in 2004 did the ADJUSTED
vote come up short of the EXIT POLL share. The 2004 exit poll discrepancies
were different in kind and scope from those of the prior four elections. Unlike
1988-2000, the 2004 discrepancies cannot be explained by uncounted votes alone.
The analysis shown below indicates that given Census
2000/2004 estimates of total votes cast and 12:22am National Exit Poll “Voted
2000” shares, Bush needed 21.5% of
returning Gore voters to match his recorded vote! Even
using Final NEP vote shares, Bush needed 18.1% of returning Gore voters! The
Final was forced to match the recorded vote using mathematically impossible
weights and by sharply increasing Bush vote shares from the 12:22am NEP.
There are some exit
poll critics who claim that the large (5.4 WPE) 1992 exit poll discrepancy
proves that the 2004 discrepancy (7.1 WPE) was not unique and therefore to
conclude that the election was stolen based on exit poll results is
"crap" and "bad science". After all, they say, there were
no allegations of fraud in 1992. They fail to mention or are unaware of the
fact that in 1992 Clinton beat Bush I by 44.9-39.1m (43.0-37.4%), but that 9.4m votes were uncounted, of
which 70-80% were Democratic ( 75% Dem / 25% Rep are used in the model). When uncounted votes are included, the
52.0-41.5m adjusted vote (45.7-36.4%), exactly matched Clinton’s unadjusted
exit poll.
From 1988-2000,
after the uncounted adjustment, there was a 0.85% average Democratic exit poll
discrepancy and 2.9 WPE. In 2004, after the 3.4m uncounted vote adjustment, the
exit poll discrepancy was 2.8% and Bush's margin was reduced from 3.0m
(62.0-59.0) to 1.3m (62.9-61.6). But uncounted votes were only one component of
Election Fraud 2004. The Election Calculator Model determined that
approximately 5m votes were switched from Kerry to Bush.
http://uselectionatlas.org/RESULTS/
Recorded
and Uncounted Votes, Unadjusted Exit Poll WPE
Recorded Dem Rep Other Dem Rep Other WPE
Unctd Dem Rep
Avg 104.0 48.8 47.9 7.2 46.9% 46.0% 7.1% 3.76 7.5 5.7 1.9
2004 122.3 59.0 62.0 1.2 48.3% 50.7% 1.0% 7.09 3.4 2.6 0.9
2000 105.4 51.0 50.5 4.0 48.4% 47.9% 3.8% 2.01 5.4 4.0 1.3
1996 96.3 47.4 39.2 9.7 49.2% 40.7% 10.1% 1.93 8.7 6.5 2.2
1992 104.4 44.9 39.1 20.4 43.0% 37.4% 19.6% 5.40 9.4 7.1 2.4
1988 91.6 41.8 48.9 0.9 45.6% 53.4% 1.0% 2.38 10.6 7.9 2.6
Adjusted
Votes Shares vs. Exit Poll
(after
allocating uncounted votes)
Adj. Votes Dem Rep Other Dem Rep Other EPDem Diff EP2pty Unctd/Votes cast
Avg 111.5 54.5 49.8 7.2 48.9% 44.6% 6.5% 48.8% 0.1% 52.7% 7.0%
2004 125.7 61.6 62.9 1.2 49.0% 50.0% 1.0% 51.8% -2.8% 52.3% 2.74%
2000 110.8 55.0 51.8 4.0 49.7% 46.8% 3.6% 49.4% 0.3% 51.4% 4.86%
1996 105.0 54.0 41.4 9.7 51.4% 39.4% 9.2% 50.2% 1.2% 55.8% 8.31%
1992 113.9 52.0 41.5 20.4 45.7% 36.4% 17.9% 45.7% 0.0% 56.8% 8.48%
1988 102.2 49.8 51.5 0.9 48.7% 50.4% 0.9% 46.8% 1.9% 47.3% 10.37%
The Census Bureau website states the following:
“The data are from
the November 2004 Voting and Registration Supplement to the Current Population
Survey (CPS). Statistics from surveys are subject to sampling and non-sampling
error. The CPS estimate of overall turnout (125.7 million) differs from the
“official” turnout, as reported by the Clerk of the House (122.3 million). For
further information on the source of the data and accuracy of the estimates,
including standard errors and confidence intervals, go here.
The difference between the 2004 recorded vote total and the U.S. Census estimate is 3.45m votes. The Census survey margin of error is 0.30%. According to investigative reporter Greg Palast, government records show that 3.006m votes were uncounted, comprised of 1.389m spoiled, 1.091m provisional and .0.526m absentee ballots.
Note that the 3.4m
estimated difference is a net figure.
In 13 states the official vote exceeded the Census estimate by 730,000
votes. The largest discrepancies were
in Florida (238k), Ohio (143k) and Tennessee (118k). Apparently more votes were padded than suppressed in the 13
states. But the net discrepancy does not contain the necessary information to
calculate the actual number of uncounted and padded votes.
There are many
combinations which would provide the net number. For example, of the 3.4m vote
difference, 4.0m could have been suppressed (uncounted) and 0.6m padded
(stuffed). Or 5.0m suppressed and 1.6m padded. In Florida, the least onerous
case would be if the total 238k discrepancy was due to vote padding. But it is
far more likely that vote padding occurred in Republican districts while vote
suppression took place in heavily Democratic minority districts. The net 238k
difference could have been due to 338k padded and 100k suppressed votes.
______________________________________________________________________________________________________________
The Election Calculator
|
|
|
|
|
|
|
|
|
|
|
|
|
|
|
|
2000 Recorded |
|
|
|
|
|
|
2004 Calculated |
|
|
||
|
Voted |
Recorded |
Uncounted |
Cast |
Deaths |
Alive |
|
Turnout |
Voted |
Weight |
Kerry |
Bush |
Other |
|
|
|
|
|
|
|
|
DNV |
25.62 |
20.4% |
57% |
41% |
2% |
|
Gore |
51.00 |
4.04 |
55.04 |
2.72 |
52.32 |
|
95% |
49.70 |
39.5% |
91% |
8% |
1% |
|
Bush |
50.46 |
1.08 |
51.53 |
2.48 |
49.06 |
|
95% |
46.60 |
37.1% |
10% |
90% |
0% |
|
Nader/other |
3.96 |
0.27 |
4.23 |
0.21 |
4.02 |
|
95% |
3.82 |
3.0% |
64% |
17% |
19% |
|
|
|
|
|
|
|
|
|
|
|
|
|
|
|
Total |
105.42 |
5.38 |
110.80 |
5.41 |
105.39 |
|
100.13 |
125.74 |
100% |
53.23% |
45.39% |
1.38% |
|
|
|
|
|
|
|
|
|
|
125.74 |
66.94 |
57.07 |
1.74 |
|
|
|
|
|
|
|
|
|
|
|
|
||
|
|
|
Sensitivity Analysis |
|
|
|
|
Sensitivity Analysis |
|
||||
|
|
|
Kerry National Vote |
|
|
|
|
Kerry National Vote |
|
||||
|
Gore share of |
|
|
|
|
|
|
Kerry share of |
|
|
|
|
|
|
Uncounted in 2000 |
Gore Voter Turnout |
|
|
|
Gore voters |
Share of New voters (DNV in 2000) |
||||||
|
53.2% |
91.0% |
93.0% |
95.0% |
97.0% |
99.0% |
|
53.2% |
53.0% |
55.0% |
57.0% |
59.0% |
61.0% |
|
95.0% |
53.3% |
53.6% |
53.9% |
54.2% |
54.5% |
|
95.0% |
54.0% |
54.4% |
54.8% |
55.2% |
55.6% |
|
85.0% |
53.0% |
53.3% |
53.6% |
53.9% |
54.1% |
|
93.0% |
53.2% |
53.6% |
54.0% |
54.4% |
54.8% |
|
75.0% |
52.7% |
52.9% |
53.2% |
53.5% |
53.8% |
|
91.0% |
52.4% |
52.8% |
53.2% |
53.6% |
54.0% |
|
65.0% |
52.3% |
52.6% |
52.9% |
53.2% |
53.5% |
|
89.0% |
51.6% |
52.0% |
52.4% |
52.8% |
53.3% |
|
55.0% |
52.0% |
52.3% |
52.6% |
52.9% |
53.1% |
|
87.0% |
50.8% |
51.2% |
51.7% |
52.1% |
52.5% |
|
|
|
|
|
|
|
|
|
|
|
|
|
|
|
|
|
Kerry Margin (millions) |
|
|
|
|
Kerry Margin (millions) |
|
||||
|
|
|
|
|
|
|
|
|
|
|
|
|
|
|
9.87 |
91.0% |
93.0% |
95.0% |
97.0% |
99.0% |
|
9.87 |
53.0% |
55.0% |
57.0% |
59.0% |
61.0% |
|
95.0% |
10.1 |
10.8 |
11.5 |
12.3 |
13.0 |
|
95.0% |
11.8 |
12.8 |
13.8 |
14.9 |
15.9 |
|
85.0% |
9.2 |
10.0 |
10.7 |
11.4 |
12.2 |
|
93.0% |
9.8 |
10.8 |
11.9 |
12.9 |
13.9 |
|
75.0% |
8.4 |
9.1 |
9.9 |
10.6 |
11.3 |
|
91.0% |
7.8 |
8.8 |
9.9 |
10.9 |
11.9 |
|
65.0% |
7.6 |
8.3 |
9.0 |
9.8 |
10.5 |
|
89.0% |
5.8 |
6.9 |
7.9 |
8.9 |
9.9 |
|
55.0% |
6.8 |
7.5 |
8.2 |
8.9 |
9.6 |
|
87.0% |
3.8 |
4.9 |
5.9 |
6.9 |
7.9 |
|
|
|
|
|
|
|
|
|
|
|
|
|
|
|
|
|
|
|
|
|
|
|
|
|
|
|
|
|
|
|
|
|
|
|
|
|
|
|
|
|
|
|
|
|
Sensitivity Analysis |
|
|
|
|
Sensitivity Analysis |
|
||||
|
|
|
Kerry National Vote |
|
|
|
|
Kerry National Vote |
|
||||
|
Bush 2000 Voter |
|
|
|
|
|
Kerry share of |
|
|
|
|
||
|
Turnout in '04 |
|
Gore Voter Turnout in '04 |
|
|
Gore voters |
Share of Bush voters |
|
|
||||
|
53.2% |
91.0% |
93.0% |
95.0% |
97.0% |
99.0% |
|
53.2% |
8.0% |
9.0% |
10.0% |
11.0% |
12.0% |
|
91.0% |
53.4% |
53.7% |
54.0% |
54.3% |
54.5% |
|
95.0% |
54.1% |
54.4% |
54.8% |
55.2% |
55.6% |
|
93.0% |
53.0% |
53.3% |
53.6% |
53.9% |
54.2% |
|
93.0% |
53.3% |
53.7% |
54.0% |
54.4% |
54.8% |
|
95.0% |
52.7% |
52.9% |
53.2% |
53.5% |
53.8% |
|
91.0% |
52.5% |
52.9% |
53.2% |
53.6% |
54.0% |
|
97.0% |
52.3% |
52.6% |
52.9% |
53.2% |
53.4% |
|
89.0% |
51.7% |
52.1% |
52.4% |
52.8% |
53.2% |
|
99.0% |
51.9% |
52.2% |
52.5% |
52.8% |
53.1% |
|
87.0% |
50.9% |
51.3% |
51.7% |
52.0% |
52.4% |
|
|
|
|
|
|
|
|
|
|
|
|
|
|
|
|
|
Kerry Margin (millions) |
|
|
|
|
Kerry Margin (millions) |
|
||||
|
|
|
|
|
|
|
|
|
|
|
|
|
|
|
9.87 |
91.0% |
93.0% |
95.0% |
97.0% |
99.0% |
|
9.87 |
8.0% |
9.0% |
10.0% |
11.0% |
12.0% |
|
91.0% |
10.3 |
11.0 |
11.7 |
12.5 |
13.2 |
|
95.0% |
12.0 |
12.9 |
13.8 |
14.8 |
15.7 |
|
93.0% |
9.4 |
10.1 |
10.8 |
11.5 |
12.3 |
|
93.0% |
10.0 |
10.9 |
11.9 |
12.8 |
13.7 |
|
95.0% |
8.4 |
9.1 |
9.9 |
10.6 |
11.3 |
|
91.0% |
8.0 |
8.9 |
9.9 |
10.8 |
11.7 |
|
97.0% |
7.5 |
8.2 |
8.9 |
9.6 |
10.4 |
|
89.0% |
6.0 |
6.9 |
7.9 |
8.8 |
9.7 |
|
99.0% |
6.5 |
7.3 |
8.0 |
8.7 |
9.4 |
|
87.0% |
4.0 |
5.0 |
5.9 |
6.8 |
7.8 |
|
|
|
|
|
|
|
|
|
|
|
|
|
|
|
|
|
|
|
|
|
|
|
|
|
|
|
|
Using the above input assumptions as the base case, let’s look at several 2000/2004 uncounted vote scenarios based on the Final Exit Poll (13660 respondents) and preliminary 12:22am Exit Poll (13047 respondents) vote shares:
|
Required Bush share of
returning Gore voters: 2000-2004
uncounted vote scenarios Most likely scenario: 2000/2004 U.S. Vote Census
estimates and the 12:22am NEP “Voted 2000” shares (13047 respondents): Bush needed 21.5%
of returning Gore voters to match his recorded vote! Least likely scenario: Vote Census estimates and the
Final NEP “Voted 2000” shares (13660 respondents): Bush needed 18.1%
of returning Gore voters to match his recorded vote! |
|
||||||||||||||
|
|
|
||||||||||||||
|
Assumptions |
|
||||||||||||||
|
1.22% annual voter
mortality |
|
||||||||||||||
|
95% of 2000 voters
turned out to vote in 2004 |
|
||||||||||||||
|
|
|
||||||||||||||
|
Final NEP vote shares: |
|
||||||||||||||
|
Uncounted votes included
for 2000 and 2004: Bush required 18.1% of returning Gore Voters |
|
||||||||||||||
|
Uncounted votes not
included: Bush required 16.3% of returning Gore Voters |
|
||||||||||||||
|
|
|
||||||||||||||
|
12:22am NEP vote shares: |
|
||||||||||||||
|
Uncounted votes included for 2000 and 2004: Bush
required 21.5% of returning Gore Voters |
|
||||||||||||||
|
Uncounted votes not
included: Bush required 20.0% of returning Gore Voters |
|
||||||||||||||
|
|
|
||||||||||||||
|
|
|
|
|
|
|
|
|
|
|
|
|
|
|||
|
Final
NEP Voted 2000 shares |
|
|
|
|
|
|
|
||||||||
|
|
|
|
|
|
|
|
|
|
|
|
|
|
|||
|
3.45m
(2.74%) Uncounted in 2004, none in 2000 |
|
|
|
|
|
|
|
||||||||
|
|
2000 Recorded |
|
|
|
|
|
|
2004 Calculated |
|
||||||
|
Voted |
Recorded |
Uncounted |
Cast |
Deaths |
Alive |
|
Turnout |
Voted |
Weight |
Kerry |
Bush |
Other |
|||
|
|
|
|
|
|
|
|
DNV |
30.48 |
24.2% |
54.0% |
45% |
1% |
|||
|
Gore |
51.00 |
0.00 |
51.00 |
2.59 |
48.41 |
|
95% |
45.99 |
36.6% |
82.3% |
16.7% |
1% |
|||
|
Bush |
50.46 |
0.00 |
50.46 |
2.36 |
48.10 |
|
95% |
45.69 |
36.3% |
9% |
91% |
0% |
|||
|
Nader Other |
3.957 |
0.00 |
3.96 |
0.19 |
3.76 |
|
95% |
3.58 |
2.8% |
71% |
21% |
8% |
|||
|
|
|
|
|
|
|
|
|
|
|
|
|
|
|||
|
Total |
105.42 |
0.00 |
105.42 |
5.14 |
100.27 |
|
95.26 |
125.74 |
1.00 |
48.48% |
50.68% |
0.84% |
|||
|
|
|
|
|
|
|
|
|
|
125.74 |
60.96 |
63.73 |
1.05 |
|||
|
|
|
|
|
|
|
|
|
|
|
|
|
|
|||
|
No
uncounted votes in 2000 and 2004 |
|
|
|
|
|
|
|
|
|||||||
|
|
2000 Recorded |
|
|
|
|
|
|
2004 Calculated |
|
||||||
|
Voted |
Recorded |
Uncounted |
Cast |
Deaths |
Alive |
|
Turnout |
Voted |
Weight |
Kerry |
Bush |
Other |
|||
|
|
|
|
|
|
|
|
DNV |
27.03 |
22.1% |
54% |
45% |
1% |
|||
|
Gore |
51.00 |
0.00 |
51.00 |
2.59 |
48.41 |
|
95% |
45.99 |
37.6% |
82.7% |
16.3% |
1% |
|||
|
Bush |
50.46 |
0.00 |
50.46 |
2.36 |
48.10 |
|
95% |
45.69 |
37.4% |
9% |
91% |
0% |
|||
|
Other |
3.96 |
0.00 |
3.96 |
0.19 |
3.76 |
|
95% |
3.58 |
2.9% |
71% |
21% |
8% |
|||
|
|
|
|
|
|
|
|
|
|
|
|
|
|
|||
|
Total |
105.42 |
0.00 |
105.42 |
5.14 |
100.27 |
|
95.26 |
122.29 |
100% |
48.48% |
50.69% |
0.83% |
|||
|
|
|
|
|
|
|
|
|
|
122.29 |
59.28 |
61.99 |
1.02 |
|||
|
|
|
|
|
|
|
|
|
|
|
|
|
|
|||
|
5.4m
(4.86%) Uncounted in 2000, 3.45m (2.74%) in 2004 |
|
|
|
|
|
|
|||||||||
|
|
2000 Recorded |
|
|
|
|
|
|
2004 Calculated |
|
||||||
|
Voted |
Recorded |
Uncounted |
Cast |
Deaths |
Alive |
|
Turnout |
Voted |
Weight |
Kerry |
Bush |
Other |
|||
|
|
|
|
|
|
|
|
DNV |
25.61 |
20.4% |
54% |
45% |
1% |
|||
|
Gore |
51.00 |
4.04 |
55.04 |
2.72 |
52.32 |
|
95% |
49.70 |
39.5% |
80.9% |
18.1% |
1% |
|||
|
Bush |
50.46 |
1.08 |
51.53 |
2.48 |
49.06 |
|
95% |
46.60 |
37.1% |
9% |
91% |
0% |
|||
|
Nader/Other |
3.96 |
0.27 |
4.23 |
0.21 |
4.02 |
|
95% |
3.82 |
3.0% |
71% |
21% |
8% |
|||
|
|
|
|
|
|
|
|
|
|
|
|
|
|
|||
|
Total |
105.42 |
5.38 |
110.80 |
5.41 |
105.39 |
|
100.13 |
125.74 |
100% |
48.47% |
50.69% |
0.84% |
|||
|
|
|
|
|
|
|
|
|
|
125.74 |
60.95 |
63.73 |
1.06 |
|||
|
|
|
|
|
|
|
|
|
|
|
|
|
|
|||
|
5.4m
(4.86%) Uncounted in 2000, none in 2004 |
|
|
|
|
|
|
|
||||||||
|
|
|
|
|
|
|
|
|
|
|
|
|
|
|||
|
|
2000 Recorded |
|
|
|
|
|
|
2004 Calculated |
|
||||||
|
Voted |
Recorded |
Uncounted |
Cast |
Deaths |
Alive |
|
Turnout |
Voted |
Weight |
Kerry |
Bush |
Other |
|||
|
|
|
|
|
|
|
|
DNV |
22.17 |
18.1% |
54% |
45% |
1% |
|||
|
Gore |
51.00 |
4.04 |
55.04 |
2.72 |
52.32 |
|
95% |
49.70 |
40.6% |
81.3% |
17.7% |
1% |
|||
|
Bush |
50.46 |
1.08 |
51.53 |
2.48 |
49.06 |
|
95% |
46.60 |
38.1% |
9% |
91% |
0% |
|||
|
Nader/Other |
3.96 |
0.27 |
4.23 |
0.21 |
4.02 |
|
95% |
3.82 |
3.1% |
71% |
21% |
8% |
|||
|
|
|
|
|
|
|
|
|
|
|
|
|
|
|||
|
Total |
105.42 |
5.38 |
110.80 |
5.41 |
105.39 |
|
100.13 |
122.29 |
100% |
48.48% |
50.68% |
0.84% |
|||
|
|
|
|
|
|
|
|
|
|
122.29 |
59.29 |
61.98 |
1.02 |
|||
|
|
|
|
|
|
|
|
|
|
|
|
|
|
|||
|
12:22am
NEP Voted 2000 shares |
|
|
|
|
|
|
|
||||||||
|
|
|
|
|
|
|
|
|
|
|
|
|
|
|||
|
5.4m
(4.86%) Uncounted in 2000, 3.45m (2.74%) in 2004 |
|
|
|
|
|
|
|||||||||
|
|
|
|
|
|
|
|
|
|
|
|
|
|
|||
|
|
2000 Recorded |
|
|
|
|
|
|
2004 Calculated |
|
||||||
|
Voted |
Recorded |
Uncounted |
Cast |
Deaths |
Alive |
|
Turnout |
Voted |
Weight |
Kerry |
Bush |
Other |
|||
|
|
|
|
|
|
|
|
DNV |
25.62 |
20.4% |
57% |
41% |
2% |
|||
|
Gore |
51.00 |
4.04 |
55.04 |
2.72 |
52.32 |
|
95% |
49.70 |
39.5% |
77.5% |
21.5% |
1% |
|||
|
Bush |
50.46 |
1.08 |
51.53 |
2.48 |
49.06 |
|
95% |
46.60 |
37.1% |
10% |
90% |
0% |
|||
|
Nader/other |
3.96 |
0.27 |
4.23 |
0.21 |
4.02 |
|
95% |
3.82 |
3.0% |
64% |
17% |
19% |
|||
|
|
|
|
|
|
|
|
|
|
|
|
|
|
|||
|
Total |
105.42 |
5.38 |
110.80 |
5.41 |
105.39 |
|
100.13 |
125.74 |
100% |
47.90% |
50.72% |
1.38% |
|||
|
|
|
|
|
|
|
|
|
|
125.74 |
60.23 |
63.78 |
1.74 |
|||
|
|
|
|
|
|
|
|
|
|
|
|
|
|
|||
|
No
uncounted votes in 2000 and 2004 |
|
|
|
|
|
|
|
|
|||||||
|
|
|
|
|
|
|
|
|
|
|
|
|
|
|||
|
|
2000 Recorded |
|
|
|
|
|
|
2004 Calculated |
|
||||||
|
Voted |
Recorded |
Uncounted |
Cast |
Deaths |
Alive |
|
Turnout |
Voted |
Weight |
Kerry |
Bush |
Other |
|||
|
|
|
|
|
|
|
|
DNV |
27.03 |
22.1% |
57% |
41% |
2% |
|||
|
Gore |
51.00 |
0.00 |
51.00 |
2.59 |
48.41 |
|
95% |
45.99 |
37.6% |
79.0% |
20.0% |
1% |
|||
|
Bush |
50.46 |
0.00 |
50.46 |
2.36 |
48.10 |
|
95% |
45.69 |
37.4% |
10% |
90% |
0% |
|||
|
Nader/other |
3.96 |
0.00 |
3.96 |
0.19 |
3.76 |
|
95% |
3.58 |
2.9% |
64% |
17% |
19% |
|||
|
|
|
|
|
|
|
|
|
|
|
|
|
|
|||
|
Total |
105.42 |
0.00 |
105.42 |
5.14 |
100.27 |
|
95.26 |
122.29 |
100% |
47.92% |
50.71% |
1.37% |
|||
|
|
|
|
|
|
|
|
|
|
122.29 |
58.60 |
62.01 |
1.68 |
|||
|
|
|
|
|
|
|
|
|
|
|
|
|
|
|||
Calculation of 2004 Switched
Votes (assuming zero uncounted votes in
2000)
Based on the 12:22am NEP vote shares with feasible weights, Kerry’s true vote was 66.1 million. Given his recorded 59.0m vote and the net uncounted votes, we can approximate the number of votes which were switched to Bush. Assuming that Kerry won 2.6m of the 3.45m (75%) net uncounted votes, then approximately 4.5m (6.8%) votes must have been switched to Bush. Assuming that the votes were switched uniformly and allocating uncounted votes to each state according to the population and racial mix, Kerry won 336 electoral votes, matching the 2004 Election Model forcast. The Monte Carlo simulation indicated that Kerry would win 337 electoral votes (assuming that he captured 75% of the undecided vote).
Approximately
4.5 million votes were switched from Kerry to
Bush
Given:
125.74m votes cast (2004 Census)
122.29m votes recorded
3.45m votes uncounted
Assume:
2.58m (75%) uncounted votes for Kerry
0.87% annual mortality
95% turnout of Gore and Bush 2000 voters
Calculate:
The approximate number of Kerry votes which
were switched to Bush.
True Vote (T) = Recorded (R) + Net Uncounted
(U) + Switched (S)
S = 4.5 = T - R - U = 66.10 - 59.03 - 2.58
Approximately
4.5 million votes were switched from Kerry to
Bush
Switched vote rate:
SVR = S / T = 4.5/ 66.10 = 6.8%
True Vote
Reconciliation
Recorded Share
Uncounted (net)
Switched True Vote
Kerry
59.027 75% 2.584
61.611
4.488 6.79% 66.097
52.57%
Bush
62.040 24% 0.827
62.867 -4.488 -7.69% 58.375
46.43%
Other
1.228 1%
0.034 1.262 0.000 0.00%
1.262 1.01%
Total
122.30 100% 3.445
125.74
0.000 0.00% 125.74
100.0%
VOTE
DISCREPANCY ASSUMPTIONS
(Votes
in thousands)
NET
UNCOUNTED VOTE SHARE
Kerry 75%:2,582
Bush 24%: 826
Other 1%: 34
Total 100%: 3,443 (2.74% of Census
125.7mm)
SWITCHED
VOTES
4,488 (6.79%) of Kerry Votes were
switched to Bush
KERRY
VOTE RECONCILIATION
TrueVote 66,097 100.0%
Unctd -2,582 3.91%
Net 63,515
96.09%
Switch -4,488 6.79%
Recorded 59,027 89.30%
EFFECT
ON POPULAR AND ELECTORAL VOTE
True Vote Electoral Vote
Kerry Bush Kerry
Bush
Actual
59027
62040
252
286
Change 7070
-3662 97
-97
True
66097 58378 336 202
VOTE
52.57%
46.43%
BASE
CASE SUMMARY
Switched votes: 6.8%
Share RECORDED
UNCOUNTED ADJUSTED
SWITCHED TRUE VOTE
Kerry 75%
59027 48.27% 2582 61609
49.0% 2.11% 4488 66097 52.57%
Bush
24% 62040
50.73
826
62866 50.0% 0.68%
-4488
58378 46.43%
Other
1% 1228
1.00
34
1262 1.0% 0.03%
0
1262 1.00%
Total
2.74% 122295
100.0 3442 125737
100.0% 2.81% 0
125737 100.0%
SENSITIVITY
ANALYSIS I
Various
effects of incremental switched vote rates (SVR)
(Kerry
75% share of uncounted votes)
Recorded
Share Recorded Vote
Kerry Electoral Vote
Kerry
Bush Kerry
Bush Margin Kerry
Bush States which
Recorded 48.27% 50.73% 59027
62040 -3013
252 286 flipped to Bush
SVR
6.8%
52.57% 46.43% 66097
58383 7714
336 202 CO FL IA MO
NV NM OH
6.5%
52.42% 46.58% 65906
58570 7336
325 213 CO FL IA NV
NM OH
6.0%
52.15% 46.84% 65575
58901 6675 325
213 CO FL IA NV NM OH
5.0%
51.63% 47.37% 64914
59562 5353
325 213 CO FL IA NV
NM OH
4.0%
51.10% 47.90% 64253
60223 4031
325 213 CO FL IA NV
NM OH
3.0%
50.58% 48.42% 63592
60883 2709
289 249 IA NV NM
2.0%
50.05% 48.95% 62931
61544 1387
289 249 IA NV NM
1.0%
49.52% 49.47% 62270
62205 65
264 274 IA
NM
0.0%
49.00% 50.00% 61609 62866
-1257 264 &nnbsp;
274 IA NM
SENSITIVITY
ANALYSIS II:
Effect
of incremental uncounted (net) and switched votes on Kerry electoral vote
Uncounted Vote
Share
50% 55%
60% 65%
70% 75% 80%
SVR Kerry
Electoral
Vote
6.8%
325 325
325 325
325 336 336
6.5%
325 325
325 325
325 325 336
6.0%
325 325
325 325
325 325 325
5.0%
298 298
325 325
325 325 325
4.0%
289 289
289 289
289 325 325
3.0%
289 289 289
289 289
289 289
2.0%
264 284
284 284
289 289 289
1.0%
264 264
264 264
264 264 284
0.0%
252 252
252 252
259 264 264
SENSITIVITY
ANALYSIS III
Effect
of incremental uncounted (net) and switched votes on Kerry vote share
Uncounted Vote
Share
50% 55%
60%
65% 70%
75% 80%
SVR
Kerry Vote
Share
6.8%
51.89% 52.03% 52.16% 52.30%
52.44% 52.57% 52.71%
6.5%
51.73% 51.87% 52.00% 52.14%
52.28% 52.42% 52.55%
6.0%
51.47% 51.60% 51.74% 51.88%
52.02% 52.15% 52.29%
5.0%
50.94% 51.08% 51.22% 51.35%
51.49% 51.63% 51.76%
4.0%
50.42% 50.55% 50.69% 50.83%
50.96% 51.10% 51.24%
3.0%
49.89% 50.03% 50.16% 50.30%
50.44% 50.58% 50.71%
2.0%
49.36% 49.50% 49.64% 49.78%
49.91% 50.05% 50.19%
1.0%
48.84% 48.98% 49.11% 49.25%
49.39% 49.52% 49.66%
0.0%
48.31% 48.45% 48.59% 48.72%
48.86% 49.00% 49.14%
SENSITIVITY
ANALYSIS IV
Effect
of incremental uncounted (net) and switched votes on Kerry margin
Uncounted Vote
Share
50% 55% 60%
65% 70% 75% 80%
SVR Kerry Margin (in
thousands)
6.8%
6011 6355 6699 7044
7388 7732 8077
6.5%
5614 5958 6303 6647
6991 7336 7680
6.0%
4953 5297 5642 5986
6330 6675 7019
5.0%
3631 3975 4320 4664
5008 5353 5697
4.0%
2309 2654 2998 3342
3686 4031 4375
3.0%
987 1332 1676 2020
2365 2709 3053
2.0%
-335
10 354 698 1043 1387
1731
1.0%
-1657 -1312 -968 -6224
-279 65 409<
0.0%
-2979 -2634 -2290 -1946 --1601 -1257 -913
State Uncounted (net) and Switched Votes
(in thousands)
Recorded
Vote
Uncounted Switched
TRUE
Vote
Total Kerry Bush
Kerry Bush Kerry Bush Kerry Kerry Bush
Kerry Bush Margin
EVote
122295 59027 62040
48.27% 50.73% 2582 826
4488 66097 58378
52.57% 46.43% Change Flip
AL
1877 694 1176
37.0% 62.7%
42 14
47 784 1142
40.5% 59.1%
6.4%
AK
307
111 191
36.2% 62.2%
7 2 8
125 186
39.7% 58.7%
6.3%
AZ
1998 894 1104
44.7% 55.3%
31 10
61 986
1053 48.3% 51.6%
7.0%
AR
1049
470 573
44.8% 54.6%
19 6
32 521
547
48.5% 50.9%
7.2%
CA
12255 6745 5510
55.0% 45.0%
246 79 458
7449 5131
59.2% 40.8%
8.6%
CO
2116 1002 1101
47.4% 52.0%
31 10
68 1101
1043
51.0% 48.3%
7.3% 9
CT
1564
857 694 54.8% 44.4%
26 8
58 941
644
58.9% 40.3% 8.4%
DC
226
203 21
89.8% 9.3%
10 3 14
227 10
94.8%
4.3% 4.4%
DE
373
200 172
53.6% 46.1%
8 2
14 221
161
57.7% 42.0%
8.5%
FL
7582 3584 3965
47.3% 52.3%
140 45 243
3967 3766
51.1% 48.5%
7.5% 27
GA
3280 1366 1914
41.6% 58.4%
81 26
93 1540
1847
45.4% 54.5%
7.1%
HI
426
232 194
54.5% 45.5%
18 6 16
265 184
59.0% 40.9%
9.7%
ID
590
181 409
30.7% 69.3%
7 2 12
201 399
33.5% 66.5%
4.9%
IL
5238 2892 2346
55.2% 44.8%
99 32 196
3187 2181
59.4% 40.6%
8.6%
IN
2448 969 1479
39.6% 60.4%
37 12 66
1072 1425
42.9% 57.1%
6.3%
IA
1500
742 752 49.5% 50.1%
19 6 50
811 708
53.2% 46.4%
7.4% 7
KS
1180
435 736
36.9% 62.4%
18 6 30
482 712
40.1% 59.2%
5.9%
KY
1791 713 1069
39.8% 59.7% 26 8 48
788 1029
43.1% 56.4%
6.3%
LA
1929 820 1102
42.5% 57.1%
49 16 56
925 1062
46.4% 53.2%
7.3%
ME
735
397 330
54.0% 44.9%
9 3 27
433 306
57.9% 41.0%
8.0%
MD
2370 1334 1024
56.3% 43.2%
60 19 91
1484 952
60.6% 38.9%
9.1%
MA
2875 1804 1071
62.7% 37.3%
46 15 122
1972 963
67.2% 32.8%
9.4%
MI
4816 2479 2313
51.5% 48.0%
89 28 168
2736 2173
55.4% 44.0%
8.0%
MN
2811 1445 1347
51.4% 47.9%
41 13 98
1584 1262
55.3% 44.0%
7.8%
MS
1146
458 685
40.0% 59.8%
31 10 31
520 664
43.8% 55.9%
7.0%
MO
2715 1259 1456
46.4% 53.6%
45 15 85
1390 1385
50.1% 49.9%
7.3% 11
MT
446
174 266
39.0% 59.6% 6 2 12
192 256
42.3% 56.4%
6.1%
NE
773
254 513
32.9% 66.4%
11 3 17
282 499
35.8% 63.4%
5.3%
NV
821
397 419
48.4% 51.0%
14 5 27
438 397
52.2% 47.2%
7.6% 5
NH
675
340 331
50.4% 49.0%
8 3 23
371 311
54.1% 45.3%
7.5%
NJ
3600 1911 1670
53.1% 46.4%
72 23 130
2113 1563
57.2% 42.3%
8.4%
NM
751
370 377
49.3% 50.2%
13 4 25
408 356
53.1% 46.4%
7.7% 5
NY 7377
4314 2963
58.5% 40.2%
158 50 293
4764 2720 62.8% 35.9%
9.1%
NC
3487 1526 1961
43.8% 56.2%
74 24 104
1704 1881
47.5% 52.5%
7.2%
ND
312
111 197 35.6% 63.1%
4 1 8
123 191
38.7% 60.1%
5.7%
OH
5601 2741 2860
48.9% 51.1% 94 30 186
3021 2704
52.8% 47.2%
7.6% 20
OK
1464
504 960
34.4% 65.6%
28 9 34
566 935
37.7% 62.3%
5.8%
OR
1810
943 867
52.1% 47.9%
26 8 64
1033 811
56.0% 44.0%
7.9%
PA
5732 2938 2794
51.3% 48.7%
93 30 199
3231 2624
55.2% 44.8%
7.9%
RI
434
260 169
59.9% 38.9%
7 2 18
284 153
64.2% 34.7%
9.0%
SC
1606
662 938
41.2% 58.4%
38 12 45
745 905
45.0% 54.6%
7.0%
SD 386
149 233
38.6% 60.4%
6 2 10
165 225
41.9% 57.1%
6.1%
TN
2429 1036 1384
42.7% 57.0%
45 14 70
1151 1328
46.3% 53.4%
6.9%
TX
7360 2833 4527 38.5% 61.5%
129 41 192
3155 4376
41.9% 58.1% 6.3%
UT
916
241 664
26.3% 72.5%
12 4 16
269 651
28.9% 69.9%
4.4%
VT
309
184 121
59.5% 39.2%
4 1 12
200 110
63.8% 34.9%
8.7%
VA
3172 1455 1717
45.9% 54.1%
68 22 99
1622 1640
49.7% 50.3%
7.5%
WA
2838 1510 1305
53.2% 46.0%
47 15 103
1660 1218
57.2% 42.0%
8.2%
WV
755
327 424
43.3% 56.2%
9 3 22
359 405
46.7% 52.7%
6.6%
WI
2984 1490 1478
49.9% 49.5%
44 14 101
1635 1391
53.7% 45.7%
7.6%
WY
242
71 168
29.3% 69.4%
3 1 5
79 164
32.0% 66.7%
4.8%
Padded Votes
|
State |
Kerry |
Bush |
Other |
Total |
Padded |
Cast |
Padded%Cast |
|
Alaska |
111 |
191 |
11 |
313 |
20 |
293 |
6.7% |
|
Colorado |
1,002 |
1,101 |
27 |
2,130 |
33 |
2,097 |
1.6% |
|
Connecticut |
857 |
694 |
27 |
1,579 |
55 |
1,524 |
3.6% |
|
Florida |
3,584 |
3,965 |
62 |
7,610 |
238 |
7,372 |
3.2% |
|
Idaho |
181 |
409 |
8 |
598 |
13 |
585 |
2.3% |
|
Maine |
397 |
330 |
14 |
741 |
5 |
736 |
0.7% |
|
Michigan |
2,479 |
2,314 |
46 |
4,839 |
21 |
4,818 |
0.4% |
|
NewHampshire |
341 |
331 |
6 |
678 |
1 |
677 |
0.1% |
|
Ohio |
2,741 |
2,860 |
27 |
5,628 |
143 |
5,485 |
2.6% |
|
SouthDakota |
149 |
233 |
6 |
388 |
10 |
378 |
2.7% |
|
Tennessee |
1,036 |
1,384 |
16 |
2,437 |
118 |
2,319 |
5.1% |
|
Virginia |
1,455 |
1,717 |
27 |
3,198 |
64 |
3,134 |
2.1% |
|
Washington |
1,510 |
1,305 |
44 |
2,859 |
8 |
2,851 |
0.3% |
|
|
|
|
|
|
|
|
|
|
Total |
15,843 |
16,833 |
322 |
32,999 |
730 |
32,269 |
2.2% |
Uncounted Votes
|
State |
Kerry |
Bush |
Other |
Total |
Unctd |
Cast |
Unctd%Cast |
|
Alabama |
694 |
1,176 |
13 |
1,883 |
177 |
2,060 |
8.6% |
|
Arizona |
894 |
1,104 |
15 |
2,013 |
226 |
2,239 |
10.1% |
|
Arkansas |
470 |
573 |
12 |
1,055 |
85 |
1,140 |
7.5% |
|
California |
6,745 |
5,510 |
165 |
12,420 |
387 |
12,807 |
3.0% |
|
Delaware |
200 |
172 |
3 |
375 |
10 |
385 |
2.6% |
|
D. C. |
203 |
21 |
3 |
228 |
42 |
270 |
15.7% |
|
Georgia |
1,366 |
1,914 |
21 |
3,302 |
30 |
3,332 |
0.9% |
|
Hawaii |
232 |
194 |
3 |
429 |
4 |
433 |
0.9% |
|
Illinois |
2,892 |
2,346 |
37 |
5,274 |
398 |
5,672 |
7.0% |
|
Indiana |
969 |
1,479 |
20 |
2,468 |
130 |
2,598 |
5.0% |
|
Iowa |
742 |
752 |
13 |
1,507 |
15 |
1,522 |
1.0% |
|
Kansas |
435 |
736 |
16 |
1,188 |
0 |
1,188 |
0.02% |
|
Kentucky |
713 |
1,069 |
14 |
1,796 |
134 |
1,930 |
6.9% |
|
Louisiana |
820 |
1,102 |
21 |
1,943 |
124 |
2,067 |
6.0% |
|
Maryland |
1,334 |
1,025 |
27 |
2,387 |
26 |
2,413 |
1.1% |
|
Massachusetts |
1,804 |
1,071 |
37 |
2,912 |
173 |
3,085 |
5.6% |
|
Minnesota |
1,445 |
1,347 |
37 |
2,828 |
59 |
2,887 |
2.0% |
|
Mississippi |
458 |
685 |
9 |
1,152 |
111 |
1,263 |
8.8% |
|
Missouri |
1,259 |
1,456 |
16 |
2,731 |
84 |
2,815 |
3.0% |
|
Montana |
174 |
266 |
11 |
450 |
32 |
482 |
6.6% |
|
Nebraska |
254 |
513 |
11 |
778 |
15 |
793 |
1.9% |
|
Nevada |
397 |
419 |
14 |
830 |
41 |
871 |
4.8% |
|
New Jersey |
1,911 |
1,670 |
30 |
3,612 |
81 |
3,693 |
2.2% |
|
New Mexico |
371 |
377 |
8 |
756 |
81 |
837 |
9.6% |
|
New York |
4,314 |
2,963 |
114 |
7,391 |
307 |
7,698 |
4.0% |
|
N Carolina |
1,526 |
1,961 |
14 |
3,501 |
138 |
3,639 |
3.8% |
|
North Dakota |
111 |
197 |
5 |
313 |
17 |
330 |
5.2% |
|
Oklahoma |
504 |
960 |
0 |
1,464 |
77 |
1,541 |
5.0% |
|
Oregon |
943 |
867 |
27 |
1,837 |
87 |
1,924 |
4.5% |
|
Pennsylvania |
2,938 |
2,794 |
38 |
5,770 |
75 |
5,845 |
1.3% |
|
Rhode Island |
260 |
169 |
8 |
437 |
30 |
467 |
6.4% |
|
S Carolina |
662 |
938 |
18 |
1,618 |
281 |
1,899 |
14.8% |
|
Texas |
2,833 |
4,527 |
51 |
7,411 |
539 |
7,950 |
6.8% |
|
Utah |
241 |
664 |
23 |
928 |
94 |
1,022 |
9.2% |
|
Vermont |
184 |
121 |
7 |
312 |
4 |
316 |
1.2% |
|
West Virginia |
327 |
424 |
6 |
756 |
42 |
798 |
5.3% |
|
Wisconsin |
1,490 |
1,478 |
29 |
2,997 |
13 |
3,010 |
0.4% |
|
Wyoming |
71 |
168 |
5 |
243 |
4 |
247 |
1.4% |
|
|
|
|
|
|
|
|
|
|
Total |
43,185 |
45,207 |
903 |
89,295 |
4,173 |
93,468 |
4.7% |