|
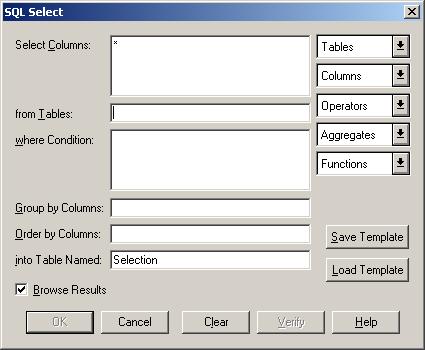
- The SQL Select dialog box appears.
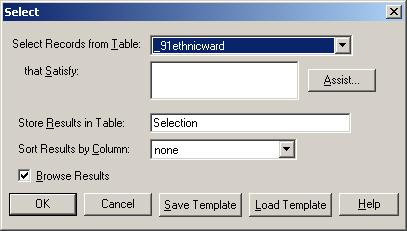
- The first stage of our query is to get rid of the Shipping ward from the table. Use the drop down menu to select the table you wish to work with. The name of this table then appears in the 'From table...' text box, the second one down.
- Click in the top textbox, 'Select Columns.' Use the drop down menu Columns to select the column which stores the zone ID, the column which stores the zone name, the column which stores the total population by ward, and the column which stores the white population by ward. The column headings appear in the textbox. These are the columns which will appear in the new table which meets the conditions of the query.
 Most queries are performed in stages, each of which eliminates certain records. Be sure to include all the columns in the first stage which you will need for subsequent stages. Most queries are performed in stages, each of which eliminates certain records. Be sure to include all the columns in the first stage which you will need for subsequent stages.
- Click in the third textbox down, 'Where condition:' Either using the Columns and Operators drop down menus, or by typing, create the following expression using the name you gave to the column representing total population: totalpersons > 0.
- Choose a self explanatory name for the new table you will create, and type this into the 'into table called' textbox. Leave the 'Group by columns' and 'Order by columns' textboxes blank.
- Click OK. A new table containing only the rows in the original table selected by the query will appear. Should you view the original table in a browser of map window, the selected wards will be highlighted. In the map view, this means all the wards will be highlighted, as the only ward excluded by this stage of the query is the Shipping ward which is not represented on the map.
- With your new table as the active window, open the SQL dialog box again (Query > SQL Select). Set the table in the 'from tables' textbox to the name of the table you have just created. Select all four of the columns in that table in the top textbox by using the Columns drop down menu.
- Click in the 'Where condition' textbox. Either using the drop down menus or by typing, enter the query ((white/totalpersons)*100) >= 90, using the column names you gave to those variables in your own table.
- Give a sensible name to your new table, and leave the 'Group columns by' and 'Order columns by' textboxes blank. Click OK.
- View the results. Observe the clustering of the highlighted areas on the map now. The highlighted areas are all but the urban areas of Bradford and Keighley.
- The new tables created from queries can also be used to create maps (Window > New Map Window or Map > Create Thematic Map) or graphs (Window > New Graph Window).
|