
updated oct.18th.'98.
|
|
|
This simple instrument can be used to calculate different
area's of
price perception. The theory says that we are more sensible to small
differences
between prices of a gamut of similar products in the lower price area
and
similarly to ever greater differences in the higher echelons. Price
scales
can be divided in different ways, for example, in three area's: low,
center
and high. You can build one copying the images and cutting two
cardboard
disks. Make also a ruler from transparent material and connect with a
pin
in the CENTER.
|

inner disk |

outer disk |
 the cursor |
| In order to calculate the extension of these different area's and the prices typical for each area we use the ruler as follows |
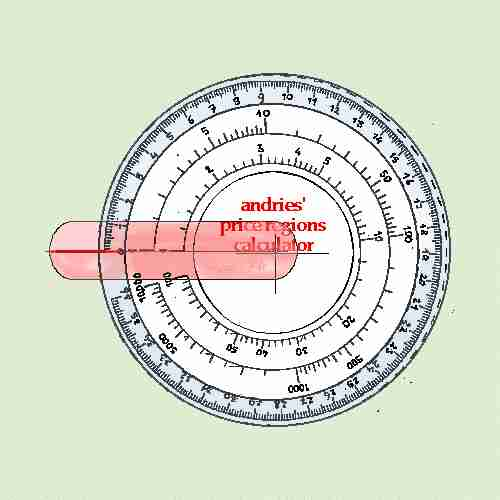 fig.1 |
step 1 (fig.1) place the zero of the outer scale and the ones on the inner disk under the cursor. |
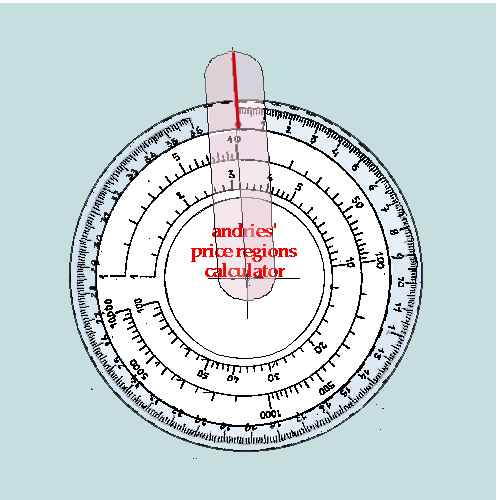 fig.2 |
step 2 (fig.2) move the inner disk, without moving the cursor, till lowest price, in our example 10, is lined up with the zero on the outer scale. It is advisable to avoid extremes because they tend to deform in an inopportune way the calculus. A very low price for example can be the result of dumping practice or special offers. Very high prices are often targeted on a particular sector of consumers, for example snobs. So just cut these extremes out to get a reliable result. |
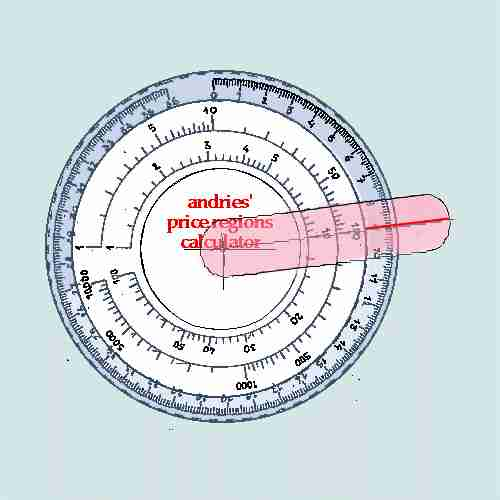 fig.3 |
step 3 (fig.3) now move the cursor, keeping the inner disk in place, till the cursor is lined up with the highest price, here 100, in your price scale. In our the case we use the scale from 1 to 100, for very extensive price ranges you can use the other scale that runs from 1 to 10.000. Read the corresponding value on the outer scale, in our case nine. Select a value that is a multiple of three for easy calculating. This is allowed because precision is not really important in this type of psychological considerations. |
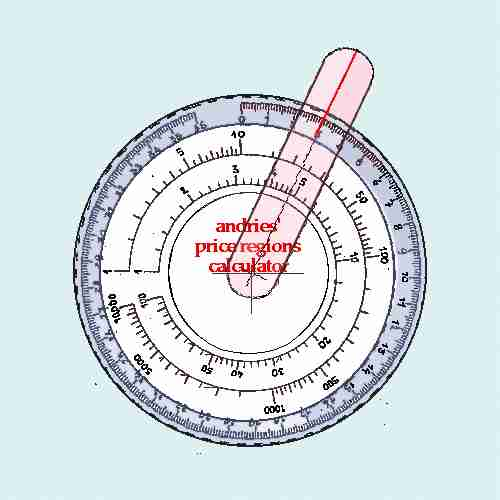 fig.4 |
step 4 (fig.4) divide the number on the outer scale by three (if you want a division in three sectors, else by any number you prefer). Turn the cursor back to that number, in our case 3, and read on the inner scale the corresponding value (in our case 12,5) the border area between the low price sector and the CENTER one). In a similar way proceed to find the value for the border area between CENTER and high prices and, dividing the outer further, each sector in two parts or, what is the same, the whole scale into six parts, you may find the typical price for each area. |
| printout for both disks |