Perth Water Users
Second Submission to ERA Water Price Inquiry 5 May 2005
In this submission Perth Water Users (PWU) do not want to repeat points
made in our September 2004 submission available on the ERA website, so
any reader of this current paper should be acquainted with the concise
3 page submission we made in September 2004. The contents
of this second submission will comprise some material to augment
two of the three points made in September 2004 and following that three
issues will be discussed, dam catchment region rainfall, Perth
groundwater and then environmental impacts from the Kwinana
Desalination Plant (KDP).
[1] At the end of our first point on page 2 in September
2004 headlined;
Wellington Dam Reverse Osmosis proposal of Agritech
we stated, “There may be other sources of slightly saline river and
stream drainage from the Darling Ranges that could be treated in this
way.”
There is now new published data to add scale to our September 2004
statement.
At the 1st National Salinity Engineering Conference, 9–12 November
2004, held at Burswood, a paper (Ref 1) reviewed stream salinity in
South West Western Australia. The (Ref 1) Abstract commences (PWU
bold), “On average, about 4700 GL of water flows out of the rivers of
the south-west into the ocean each year. Of that, 44% is fresh, 10% is
now marginal, 21% is brackish, 20% is moderately saline and the rest
has even higher salinity.”
PWU notes that the figure of 4700GL is over 100 times the
production of the proposed KDP. However this figure includes outflows
from Moore River to Pallinup east of Albany. Ref 1 notes that the
Avon, Murray and Collie have combined average flows of just over 680GL
per year and lists average salinity. The PWU point is that while
the Government is planning to desalinate seawater at the KDP, fifteen
times the output of the KDP is wasting to the sea every year in rivers
near Perth at an average salinity only 13% of seawater and much at an
elevation that would facilitate vastly cheaper gravity powered
desalination.
[2] On the first page of our September 2004
submission we stated under point 2;
“Forest and scrub regrowth has degraded Perth catchments to a point
where only 6% of rain falling ends up as stream flow into
dams.” PWU notes now in Ref 2 page 30 graphic that 2004 stream
inflows to Perth catchment dams look to be about 80GL which is less
than 3% of the 2800GL of catchment rain May to October, not
the 6% we had previously accepted. The 2800GL figure is
arrived at by a column of rain total 82cm falling from May to
October over the 3500 square kilometre catchments.
A reservation is noted here that while we are not 100% convinced
of the homogeneity of the Water Corporations (WC) stream flow data
history we are accepting the data for now.
The graphic of catchment rainfall plotted against stream flows Fig 1
below shows that stream flows since 1996 have fallen off considerably
as a proportion of rainfall. This trend is rendering our dam catchments
increasingly inefficient and makes it imperative to begin catchment
thinning across the entire catchment area forthwith. There should
be no more timewasting with the 12 year trial at Wungong on just 3.8%
of total catchment area.
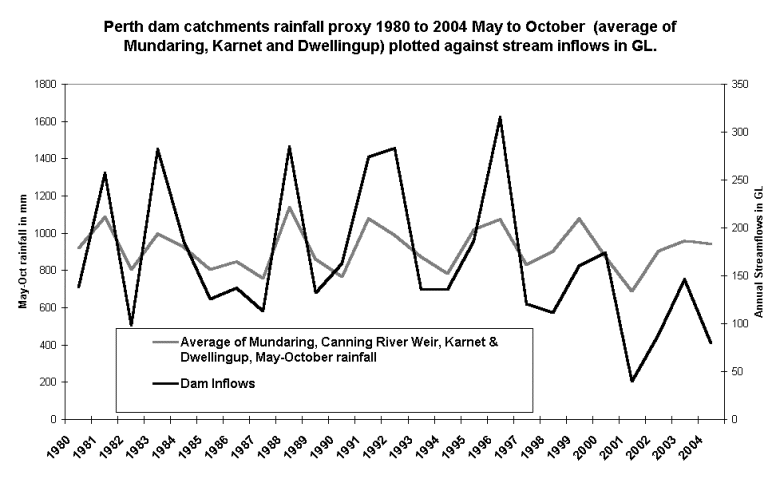
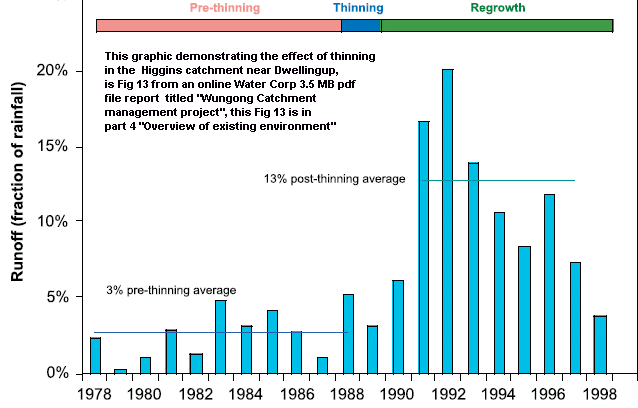
Figure 2 below is from page 28
in the book version of Ref 2 (Section 4 of online version) and
demonstrates the considerable increase in stream flows that were
generated in the Higgins catchment north of Dwellingup. It is
obvious from this graphic that catchment management must be a constant
process rotating from place to place. Note the drastic fall off
in efficiency in the years from 1991 to 1998. It is interesting
to speculate that if catchment management only caused an increase from
the 3% inflows in 2004 to say 8%, then inflows from the 2800GL of
rainfall would have been
224GL.
It is crystal clear that there need be no water crisis !!
[3] The widely promulgated slogans of “our drying climate”
and “independent of rainfall” have pervaded Government statements on
Perth water issues for years now. What does rainfall data from our
catchment regions show ?
Figure 3 (Graph A) shows trends from 1876 to 2004 and it can be
seen that our rainfall in the late 19C was on a par with recent trends
while the period from before WWI to 1960’s could be seen as a
period of abnormally high rainfall.
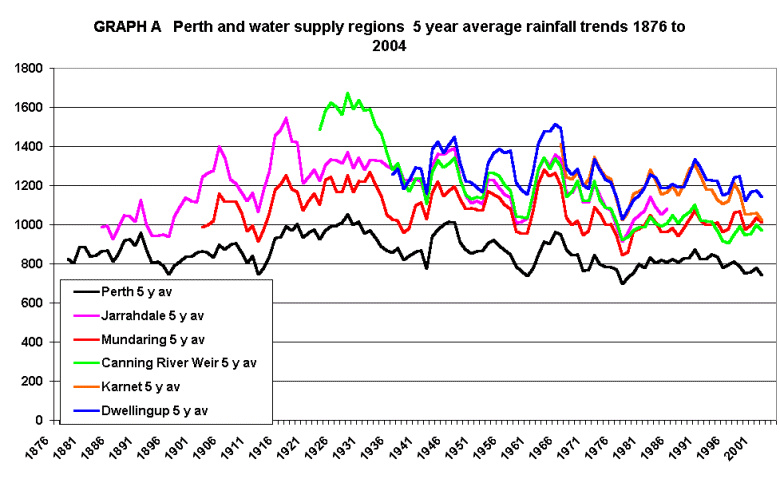
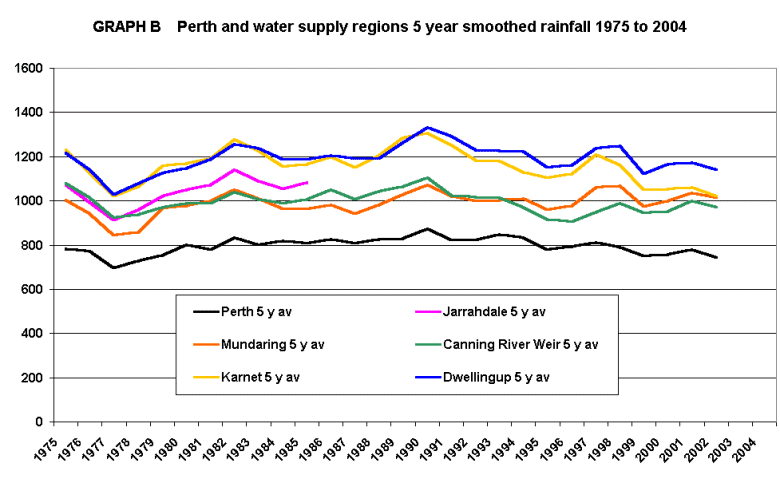
Figure 4 (Graph B) shows trends from 1975 to 2004 and PWU is saying
that our policymakers are panicking about the very minor decline in
rainfall post 1990 which is no more significant than the slight
increase in rain from 1975 to 1990.
PWU believes that the widely promulgated notion of “our drying
climate “ owes much to exaggerated predictions of the future by
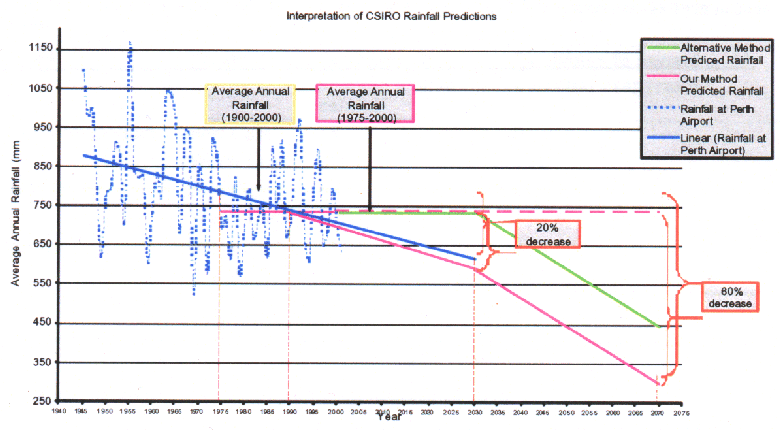
CSIRO climate modelers. An example of which is shown in Figure 5
titled “Interpretation of CSIRO Rainfall Predictions”, taken from page
35 of Ref 3 which portrays Perth Airport rainfall with a
linear trend prominently displayed to predict Perth Airport
annual rainfall will fall to circa 300mm by 2075 from current
average of around 750mm.
It is obviously very dangerous for taxpayers if such wildly speculative
diagrams are shown to non-scientific policymakers.
Figure 5
[4] Gnangara Mound groundwater supplies just over half of
Perth supply at present and the WC is under some pressure from the EPA
to cut this back
Natural recharge of the Gnangara mound has been degraded by a pine
plantation and UWA experts (see Ref 3 page 173) calculate that
replacing the pines by a mix of urban areas and native vegetation could
increase recharge by 130GL per year.
World pine log prices have fallen and PWU suspects that with
incremental water now priced at KDP costs meaning we would have to
invest circa a $Billion in future KDP clones (and run them) to replace
the water lost by the pines; the Gnangara pines can have no net present
value. The best outcome for water prices would be if the pines
were felled and sold at world prices forthwith, say within five
years. This should reduce EPA concerns about over pumping. The
Gnangara Mound covers 2140 square km and with typical May to October
rain of 60cm there would be 1200GL per year falling on the
mound of which near 50% could be available for recharge.
Quite apart from the removal of pines there may be cheap engineering
opportunities to increase recharge, such as impeding runoff in water
courses.
[5] Our last point addresses the issue of possible
understatement of environmental impacts for the KDP.
(i) The issue of energy consumption is very real because the KDP would
add about 6% extra load to Western Power’s already shaky grid.
Refs 6 and the EPA reply ref 4 and then ref 7 and EPA reply 5, go
through various coal and fired electricity generating options with WC
preferring gas fired generation because of the reduced carbon
emissions. However this misses the point that there is a
gas shortage in Perth and until that is eased any advantage WC wants to
claim by using gas will simply prevent another Western Power customer
from using gas and being able to claim lower carbon
emissions. Simply a case of load shifting. In recent
months public statements have been made in the media that the KDP will
be powered by renewable energy, probably meaning a wind turbine farm
near Geraldton. Although PWU can state that Water Corporation
plans are so ill formed on this subject that several emails asking for
information over a few weeks have all gone unanswered. If
wind generation is used with attendant huge taxpayer funded subsidies,
then unless Water Corporation intend shutting down the KDP when wind
does not blow, base load capacity is still needed in place and there is
a cost to having idle capacity built and maintained for periods when
wind is too light.
(ii) The issue of brine discharges to Cockburn Sound at
near twice the salinity of seawater has attracted adverse public
comment by several experts including UWA Centre for Water Research
Professors Imberger and Pattiaratchi. Both expressed concern on ABC
Radio in August 2004 that brine being heavier than seawater would
accumulate to some extent in deep areas of the Sound which would
increase stratification and possibly lower dissolved oxygen levels with
adverse implications for bottom dwelling biota. (Transcripts can
be supplied) In their 2002 and 2003 reports to the EPA ( refs 6 &
7), WC claimed that there was no problem to worry about and the EPA
said they could “manage” the issue. In early April 2005 WC
was due to address the Cockburn Sound Management Council (CSMC) a
Government appointed body, on the subject of KDP impacts on the
Sound. Despite this proposed talk simply being one arm of
Government talking to another, the talk had to be cancelled, so
PWU can only assume that WC is having to reassess its earlier position
that it knew how to “manage” the brine discharge impacts. More
information is awaited. So we find that after the Government
rushed to approve the KDP, serious scientific issues are still being
addressed no doubt with the prospect of increased costs to comply with
environmental guidelines.
Perth Water Users 6 May, 2005
References:
[1] 2004; X. M. Mayer, J. K. Ruprecht, P. M. Muirden and M.
A. Bari, “A review of stream salinity in the south-west of Western
Australia” , 1st National Salinity Engineering Conference 9–12 November
2004 Perth, Western Australia Affiliation: Department of Environment, 3
Plain St, East Perth 6004
[2] Water Corporation online publication, “Wungong Catchment
Environment and Water Management Project”, found at;
http://www.watercorporation.com.au/environment/environment_wungong_publications.cfm
[3] 2002. Western Australia’s Water Supply, A
Holistic Study, University of Western Australia, Centre for Water
Research.
[4] EPA Bulletin Report 1070 available in full from the EPA
website:
http://www.epa.wa.gov.au/docs/1799_B1137.pdf
[5] EPA Bulletin Report 1137). available in full from the EPA website:
http://www.epa.wa.gov.au/docs/1500_B1070.pdf
Refs 6 and 7 are Water Corporation Environmental Impact
Assessment Documents and can be found at;
http://www.watercorporation.com.au/water/water_sources_desalination_docs.cfm
[6] The Sep 2002 30 GL/annum
proposal. The EPA reply is ref 4
[7] The expansion to 45 GL Section 46 review
February 2004 EPA reply is ref 5
Back to Perth Water Users front page