This information is from an expert forex trader by using these signals to become consistently profitable in the Forex market.
Candlestick Patterns
There are three types of candlestick patterns to look for during a trading week. They are the pin bar, engulfing bar and inside bar.
While the pin bar can be traded on the 4-hour and daily time frames, both the engulfing and inside bars are most effective on the daily time frame and higher.
If you use them on any time frame lower than the daily you open yourself up to false positives.
Pin bar
For those who have followed me for a while now, it will come as no surprise to hear that my favorite candlestick pattern is the pin bar. These candles are characterized by long upper or lower wicks and represent a rejection of support or resistance.
That last sentence is paramount to the effectiveness of the pin bar pattern. Without having a key support or resistance area near the candlestick, the formation is rather meaningless.
Here's an example of a bearish pin bar on the AUDUSD daily chart:
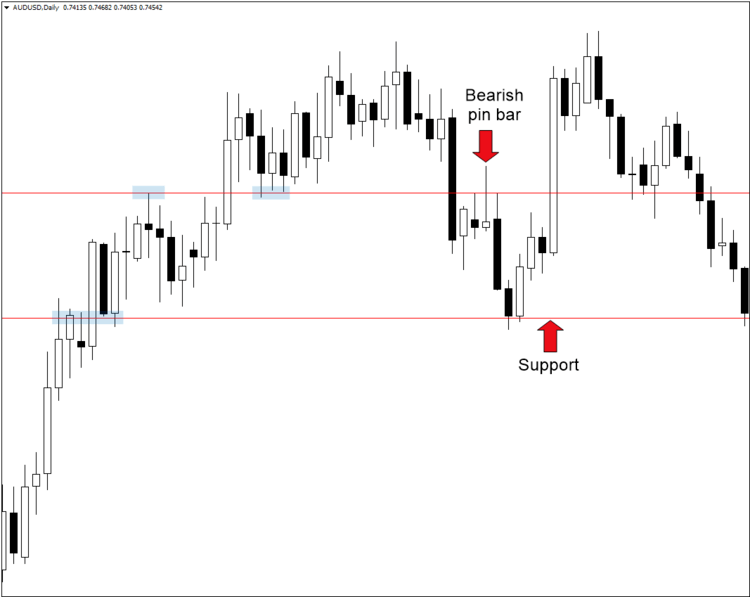
Notice how after closing below a key level, the pair formed a bearish pin bar after retesting the area as new resistance. A short entry on a 50% pullback would have yielded a tidy profit in less than 48 hours.
Engulfing bar
The engulfing bar is a reversal pattern that can often signal exhaustion from buyers or sellers. As the name implies, it's a candle that completely engulfs the previous one.
One critical rule of using this signal is only to pay attention to the engulfing patterns that develop on the daily chart and above. Any signal on the intraday charts is unreliable in the sense that it could be a false positive.
Another important point is that the candlestick pattern must form at a swing high or low. Otherwise, it won't signal the necessary exhaustion from bulls or bears that make it an effective reversal signal.
Below is an example of an engulfing candle on the AUDUSD daily chart.
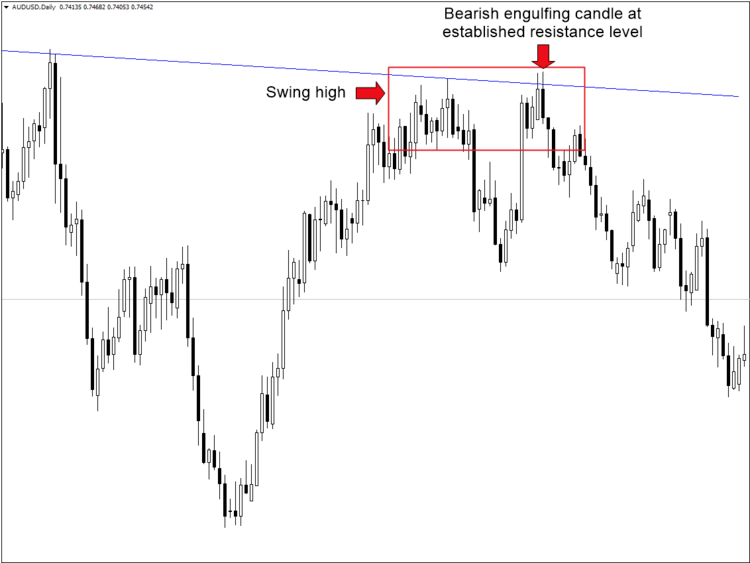
Note that the candle formed at a swing high and at a resistance level that had been in place for several months.
Inside bar
When I began trading with price action in 2010, I started with the pin bar and inside bar candlestick patterns. I figured I would learn the two signals inside and out before considering other more advanced patterns.
It was a good move. I always advocate sticking with one or two price patterns in the beginning before expanding your options. The fewer things you have to learn the easier it is to become proficient by honing in on the subject at hand.
But over the years I've moved away from trading the inside bar, at least to some degree. I still find one here and there that catches my attention, but for the most part, I don't trade it.
That doesn't mean it isn't a profitable signal. It just means that it doesn't suit my style as much as the other signals in this post.
With that said, for someone searching for a good trend trading signal, the inside bar is one of the best in my opinion. The key, however, is to make sure you stick to the daily time frame. Anything lower than that and you'll end up with too many false positives.
Below are three bullish inside bars that formed on the USDJPY daily chart during an aggressive rally.
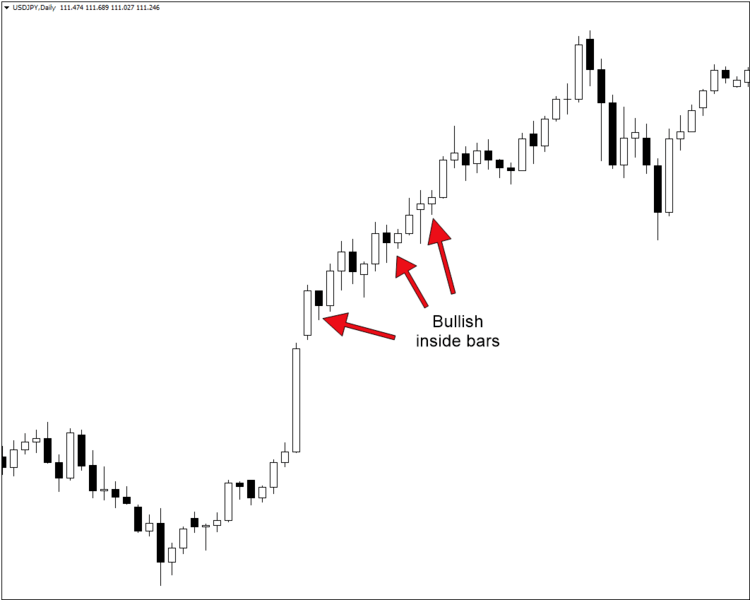
The key here is to find a pair that is trending. You should also pay close attention to the location of support and resistance before deciding to execute a trade.
Chart Patterns
Now that we've looked at the three candlestick patterns I use, let's dive into the three chart patterns. These include the head and shoulders, channels and wedges.
As the name implies, these are patterns that form over an extended period on a chart and involve multiple candlesticks. In fact, most of the technical structures I utilize take weeks, months or even years to materialize.
The good news is that we don't have to wait months or years to trade. With dozens of currency pairs at our disposal, there's almost always something to do.
Head and shoulders (and inverse)
When it comes to profitability, the head and shoulders pattern is at the top of the list. It typically forms after an extended move up and signals exhaustion from buyers.
The inverse head and shoulders pattern also represents a potential reversal but does so after an extended move down and signals exhaustion from sellers.
The reason I say these formations can be highly profitable is that they often provide several hundred pips of profit if traded successfully.
Here's a head and shoulders pattern that formed on the NZDJPY weekly chart over several months. This was a formation that I traded and also commented on several times on this site as things unfolded.
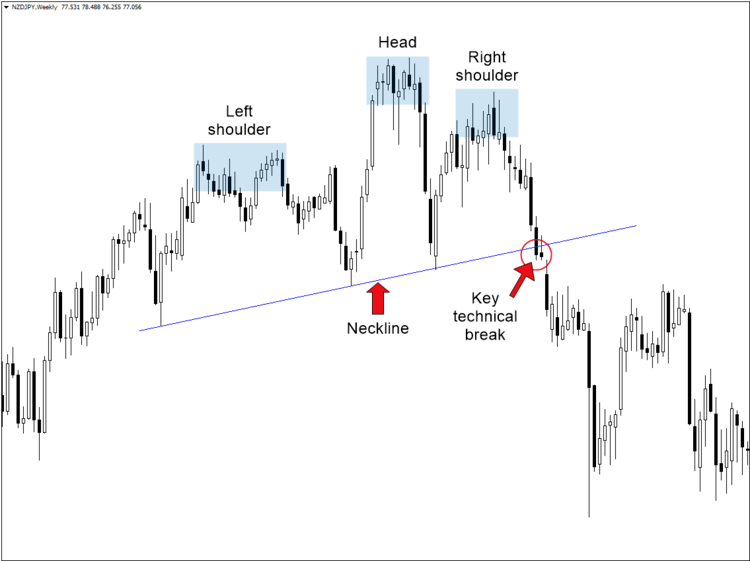
In the case of this NZDJPY reversal, the selloff totaled more than 1,200 pips.
Note that the head and shoulders also comes with what's called a measured objective. This is a potential profit target that's found using the height of the structure.
Channels (ascending and descending)
Channels occur more often than most traders probably realize. They are particularly plentiful after an impulsive move up or down. The channels that form in this manner are known as bull and bear flags.
If you've followed me for a while, you've no doubt seen me comment on either an ascending or descending channel. In fact, I bet not a single week goes by where I don't use a channel to outline the price action on a given chart.
They offer an excellent way to identify and outline periods of consolidation which can provide an opportunity to play the subsequent breakout.
Here's a recent example of an ascending channel on the NZDUSD daily chart:
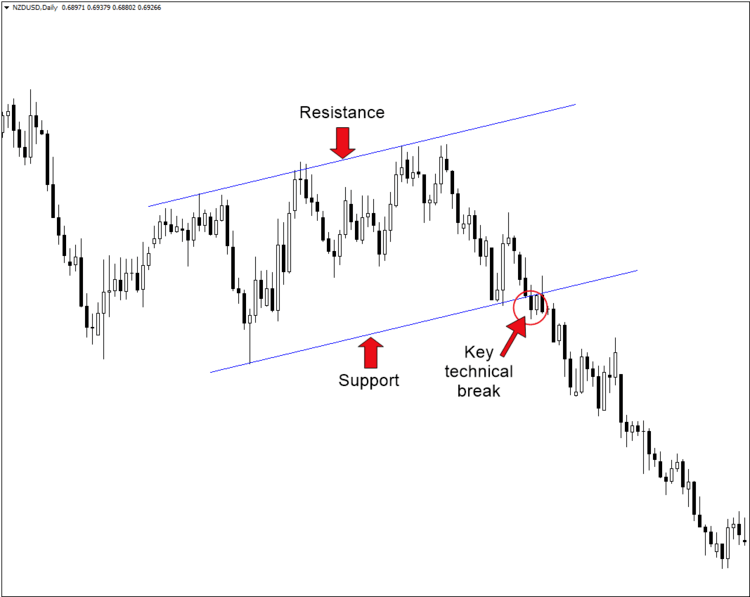
Notice how the ascending channel above began forming after an extended move lower. As such, we could also call this a bear flag, which most often represents a continuation of the prevailing trend.
While usually the result of consolidation, channels can sometimes outline a broader trend or cycle. Such is the case with the ascending channel on the NZDJPY monthly chart below.
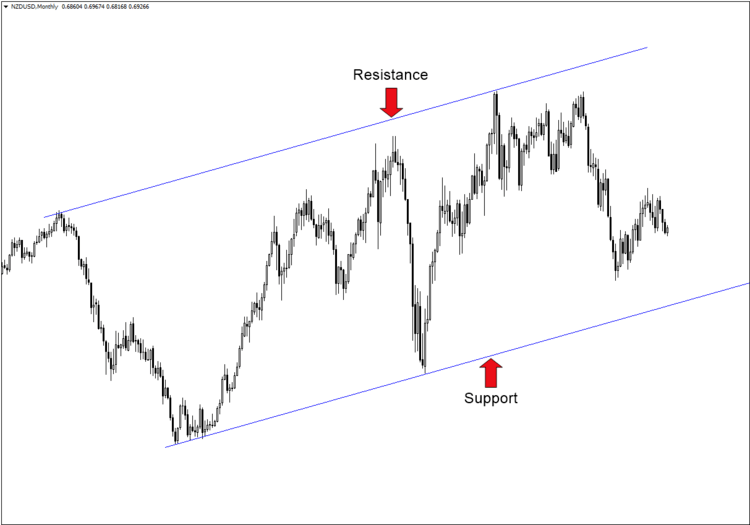
Instead of using the channel above to catch a breakout (which would take decades), I would use a formation like this to form a longer-term outlook for the pair.
Wedges (narrowing and broadening)
Like channels, wedges usually represent consolidation. However, what sets them apart is their terminal nature. In other words, a narrowing wedge has a definitive end point whereas a channel does not.
The two charts below show the difference between a narrowing wedge and a broadening wedge.
First up is a narrowing wedge on the GBPJPY 4-hour chart.
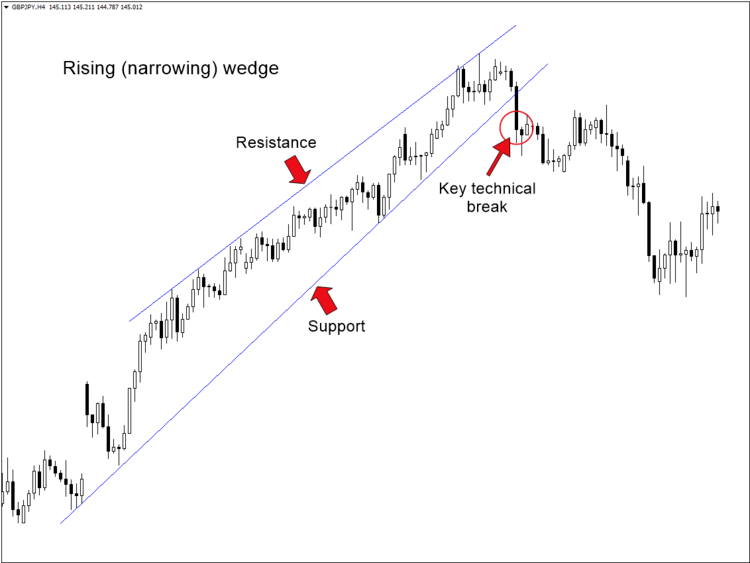
As the name implies, a narrowing wedge occurs when price action gets "squeezed" by support and resistance. Because the pair has no choice but to eventually break out, we call this a terminal pattern.
Now, here's an example of a broadening wedge on the GBPJPY 4-hour chart:

Notice how unlike the narrowing wedge in the first chart, the price action in a broadening formation "fans out" as time passes. The broadening wedge is not considered a terminal pattern because the pair could theoretically never break support or resistance.
Of course, reality says that the formation will eventually break down as was the case in the chart above.
Final Words
If you're new to price action or just looking to add an extra signal or two to your already established arsenal, the list above is a great place to start. Each one is simple yet highly profitable if you follow the lessons on this site (see links throughout this post).
My advice is to pick one or two signals, learn the characteristics, entry and exit methods, etc. before moving on. Trying to learn all six at the same time would make things harder than they have to be in my opinion.
Also, the more material you try to digest at one time, the longer it will take to become proficient. By selecting just one or two patterns, you'll be able to master them in much less time than if you took on all six at the same time.
Last but certainly not least, stick to the 4-hour and daily time frames, take notes and just keep piling on the experience. Before you know it, you'll be seeing pin bars and channels without even thinking.
Trade with confidence on the world's leading social trading platform! Trade and invest in top financial instruments, including a wide selection of stocks. Enjoy near-instant execution of market orders and no daily withdrawal limits. Invest in various markets on an intuitive trading platform.

2ndSkies Forex
Online most effective gaining many good reviews and the best part is the lowest(one time) fee Forex course with lifetime access!
*Advanced Price Action Course
*APA Ongoing Training & Webinars
*Advanced Traders Mindset Course
*ATM Meditation Series
*Advanced Ichimoku Course
Highly recommended Forex courses!
Automated Forex Trading Tools
developed base on MetaTrader platform, the most popular trading platform in the forex industry.
Benefits with advanced trading features such as Local/Remote Trade Copier(& Unlimited), Forex News Trader..
*Trading automated-saves time & effort
*Trading professional
*Target on traders' needs
*Friendly design & usage
*