Chapter 8 :
Structuring System Requirements (Process Modeling)
Objectives
- Understanding the logical modeling of processes through studying examples of data flow diagrams.
- Draw data flow diagrams following specific rules and guidelines that lead to accurate and well-structured process models.
- Decompose data flow diagrams into low-level data flow diagrams.
- Balancing higher-level and lower-level data flow diagrams.
- Explain the differences among four types of DFDs: current physical, current logical, new physical, and new logical.
- Use data flow diagrams as a tool to support the analysis of information systems.
Chapter Overview
The purpose of this chapter is to show students one particular method for modeling business processes, data flow
diagrams (DFDs). Although there are several methods and techniques available for process modeling, we have chosen to
focus on DFDs because they have been popular for many years, especially in the structured analysis and design literature.
Many CASE tools, such as the Visible Analyst Workbench�, IEF�, and others, have incorporated DFDs into their sets of
system development tools and techniques.
The chapter is divided into several distinct sections, each of which builds on what has come before. After a brief
introduction to process modeling, data flow diagramming techniques are introduced in a section called "Data Flow
Diagramming Mechanics." This section demonstrates the basic DFD symbols, definitions, and rules. We use the Gane and
Sarson symbol set throughout the book, and these symbols are explained in this section. There is also an example from
Hoosier Burger, the food ordering system first shown in Chapter 2. This section also includes explanations of
decomposition and balancing.
The second major section of Chapter 8 introduces the concept of four different types of DFDs:
(1) current physical,
(2) current logical,
(3) new logical, and
(4) new physical.
We use another example from Hoosier Burger, its inventory control system (which is manual), to illustrate the first
three types of DFDs. We point out that current practice in using DFDs indicates that very little time should be spent
on the current physical DFD.
The third major section in this chapter, "Using Data Flow Diagramming in the Analysis Process," is novel for an
introductory systems analysis and design text. In this section, guidelines for drawing and using DFDs in analysis are
introduced. This is different from the mechanical rules presented earlier. Topics include completeness, consistency,
timing, iterative development, primitive DFDs, and analyzing DFDs for system inefficiencies and discrepancies among
DFDs that are supposed to be modeling the same system. We use another Hoosier Burger example and output from Oracle's
Designer/2000 CASE tool to illustrate some of these concepts.
- Process Modeling.
- Data Flow Diagramming Mechanics.
- Four Different Types of DFDs.
- Using Data Flow Diagramming in the Analysis Process.
- Examples
Return

 Process Modeling:
Process modeling involves graphically representing the functions, or processes, which capture, manipulate, store, and
disribute data between a system and its environment and between components within a system. A common form of a process
modeling is a dtat flow diagram.
Data flow diagramming is one of several notations that called structured analysis techniques.
Data Flow Diagram:A picture of the movement of data between external entities and processes and
data stores within a system.
Modeling a system's Process
You and other team members must organize the information into a meaningful representation
of the information systemthat exists and of the requirements desired in a replacement system.
Why logical & physical DFD (Tradeoffs)
Physical data flow diagrams help you better understand the people and/or computer systems that are used in the overall
system's processing. Logical data flow diagrams help you better understand the essence of the system, the data and the
processes that transform them, regardless of actual physical form. Further, the new logical data flow diagrams can then
show any additional functionality necessary in the new system, to indicate which, if any, obsolete components have been
eliminated, and any changes in the logical flow of data between system components, including different data stores.
The data flow diagrams for the new physical system can then be constructed with the data flow diagrams for the new
logical system as a guide. As discussed in the chapter, experts used to recommend that all four levels of data flow
diagrams (current physical, new physical, current logical, and new logical) be constructed because:
(1) analysts knew little about the business of the user and needed to develop a detailed current physical data flow
diagram in order to understand the business,
(2) users were not able to work with a new logical data flow diagram right away, and
(3) there is not much work in turning current logical data flow diagrams into new logical data flow diagrams.
Sources and sinks
(The origin and/or destination of data, sometimes referred to as external entities)
Sources and sinks are always outside of the system being considered. They are of interest to the system being considered
only because they represent sources of data coming into the system and destinations for data leaving the system. If any
data processing occurs inside a source or sink, it should be of no interest to the system being modeled. If the
processing is of interest, however, or if the identified source/sink has several inputs and outputs to and from the rest
of the system, it may be better considered as an internal process.
fig8-2
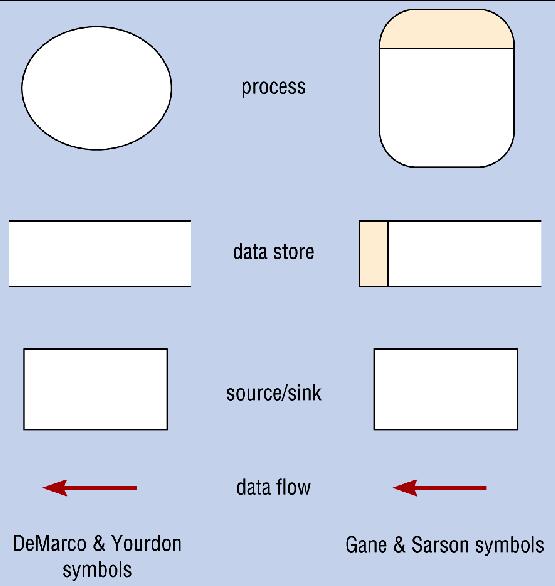
fig8-3a
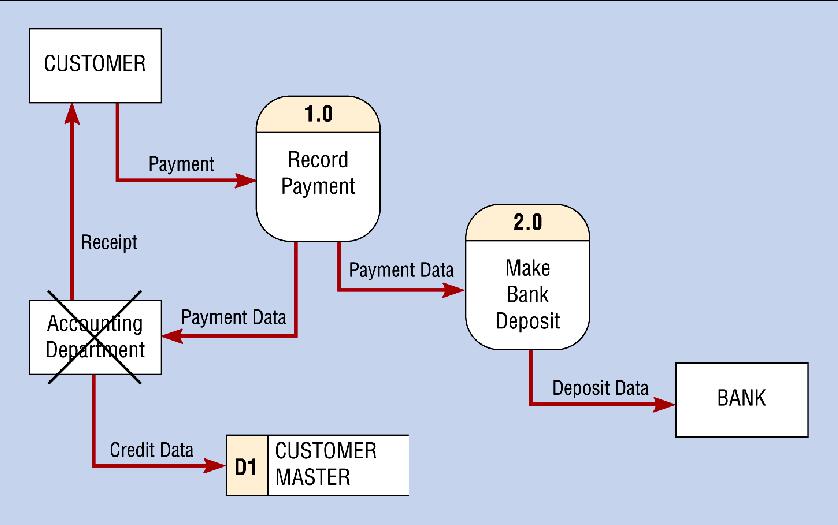
fig8-3b

The highest level DFD is called a context diagram. It represents the system as a single process, with all the related
entities and the data flows in and out of the system. The next level diagram, called a level-0, decomposes the one
process from the context diagram into two to nine high-level processes. Each process in a level-0 diagram can be
decomposed if necessary. Each resulting diagram is called a level-1. Should processes in a level-1 diagram be
decomposed, each resulting diagram would be called a level-2 diagram. Each one of these processes would be decomposed
on a level-3 diagram, and so on.
Context diagrams have only one process that represents the entire system being modeled and show only the data flows into
and out of the system. The diagram also includes sources and sinks, which represent the system's environmental
boundaries. There are usually no data stores in a context diagram
fig8-4

fig8-5

Decomposition:
Decomposition is the iterative process by which a system description is broken down into finer and finer detail,
creating a set of diagrams in which one process on a given diagram is explained in greater detail on a lower-level
diagram. Balancing is the conservation of inputs and outputs to a data flow diagram process when that process is
decomposed to a lower level. You can determine if a set of DFDs are balanced or not by observing whether or not a
process which appears in a level-n diagram has the same inputs and outputs when decomposed for a lower-level diagram.
You stop decomposing a DFD when the following six conditions are satisfied.
- Each process is a single decision or calculation or a single database operation, such as retrieve, update,
create, delete, or read.
- Each data store represents data about a single entity, such as a customer, employee, product, or order.
- The system user does not care to see any more detail, or when you and other analysts have documented sufficient
detail to do subsequent systems development tasks.
- Every data flow does not need to be split further to show that different data are handled in different ways.
- You believe that you have shown each business form or transaction, computer screen, and report as a single data
flow.
- You believe there is a separate process for each choice on all lowest-level menu options for the system.
fig8-7

fig8-8

fig8-9

Return
Four Different Types of DFDs
Current physical DFDs often show the people and technology used within a system, showing who does what and the media
on which data are stored. Current logical DFDs attempt to show the essence of the system without regard to the actual
physical implementation.
Detailed DFDs for the current physical system tend to take a great deal of time and then tend to be tossed aside as the
focus shifts from the current to the new system. By not drawing current physical DFDs, or by drawing only cursory ones,
analysts can save themselves effort and focus from the beginning on what is really important, the new system
fig8-13a
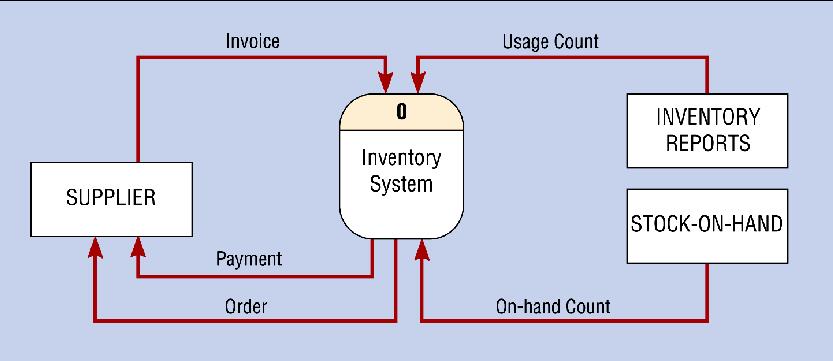
fig8-13b
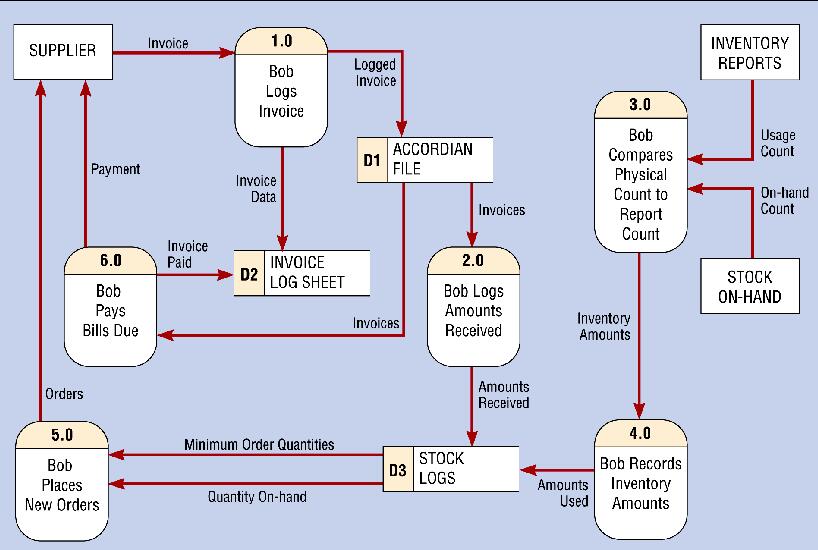
fig8-15
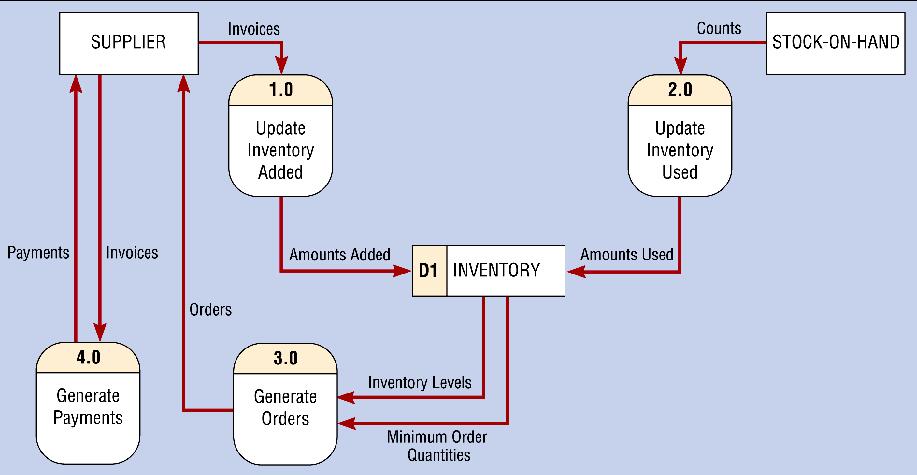
fig8-16

Return
Using Data Flow Diagramming in the Analysis Process
DFDs can be used as analysis tools to help determine the completeness of a system model and a model's internal
consistency, as a way to focus on when system events occur through analyzing timeliness, and, through iterative use,
to develop and check models. Analysts can study DFDs to find excessive information handling, thus identifying areas for
possible efficiencies.
fig8-17

For data flow diagrams to be complete, all the necessary components of a data flow diagram should be included in the
diagram and fully described in a project repository. As described in the chapter, with most CASE tools, the CASE tool's
repository, is linked to the diagram. Whenever you define (or redefine) a process, data flow, source/sink, or data store
on a data flow diagram, an entry is automatically created (or updated) in the repository for that element. Figure 8-18
shows a sample report of the contents of a CASE repository entry. It is this tight linkage between diagrams and the
CASE repository that creates much of the value of a CASE tool. Further, you cannot have an entry in the repository that
is not on some diagram. The repository is also helpful for enforcing DFD rules; for example, during decomposition, the
repository remembers what were all of the inflows and outflows of an exploded process. The repository also keeps track
of any split or joined data flows.
fig8-18

fig8-19
fig8-20

Return
Examples:
1- Problem 2:
Context

Level-0 Diagram

2- Problem 3:
Context

Level-0 Diagram

3- Problem 5:
You should continue the process of decomposition until they have reached the point where no sub-process can logically
be broken down further (i.e., each process meets the definition of a primitive process). See the level-1 data flow
diagram for this exercise, which shows a sample decomposition of the process titled Finalize Order from the level-0
data flow diagram provided for Problem and Exercise 3.
Level-1 Diagram

4- Problem 6:
Some errors and peculiarities in these diagrams include:
- Different names and numbers are used for apparently the same data store on the two diagrams.
- In the level-0 diagram, the data store, Class Roster, does not have the data flow, Scheduled Classes,
flowing into it, rather this data flow connects processes 2 and 3, thus these DFDs are not balanced.
- Process 1 appears to accomplish nothing since its inflow and outflow are identical; such processes are
uninteresting and probably unnecessary; it is possible that this process will become interesting when it is
decomposed, where validation and error handling processes might appear.
- Process 2 does not appear to need Course Request as input in order to perform its function, as implied by its
name.
- Some students may also wonder if process 3 has input sufficient to produce its output; for example, where are
prior class registrations kept so that process 3 can determine when a course is full?
5- Problem 10:
Three major errors in Figure 8-22 are:
- Process 1.0 (P2) has only inputs, making it a "black hole."
- Data flow DF5 should not move directly from source E1 to data store DS1 without first going through a process.
- Data flow DF1 should not move directly from source E1 to sink E2 without first going through a process.
- Other peculiarities (such as Process 1.0 has label P2 and the data store has only a label, not a number) are
only that, not errors.
6- Problem 11:
There is a general formatting issue with these DFDs since there are no numbers on processes and data stores, but the
student should be able to find logical errors as well. These diagrams show the decomposition of process P1 on the
level-0 diagram. Three particular logical errors in Figure 8-23 are:
- The data store DS1, not DS2, should be represented on the level?1 diagram.
- Data flow DF3 should be an outflow on the level-1 diagram, and data flow DF6 should not be on the Level-1
diagram.
- Process P1.4.2 has no inputs and is thus a "miracle."
7- Problem 12:
Context

Level-0 Diagram
