Weather and Atmospheric science
The following list of temperature readings were recorded by the Scott Base weather station since it first opened in 1957. The information was courtesy of NIWA (National Institute of Water and Atmospheric Research, New Zealand), with special thanks to Andrew Harper who emailed me the data. NIWA also carried out research into the ozone hole over Antarctica and many other interesting projects. You can find more about by them by clicking on the NIWA Hyperlink at the top of the following pages.
History of
Temperatures at Scott Base From 1957 to 1997
The Weather information below is from Hermione's (science tech at Scott Base) monthly tabulated weather report. It includes wind speeds, temperatures and barometric pressures.
![]() Weather details at Scott Base for 1997/98.
Weather details at Scott Base for 1997/98.
To Make life easier, I have hunted around the net and found a suitable wind-chill reference chart so you get an idea of the difference that wind can make to outside temperatures. I have also made up a couple of quick, temperature and speed, conversion tables so it shouldn't matter which units of measurement you like to use.
![]() Wind-chill factors / Conversion Tables.
Wind-chill factors / Conversion Tables.
![]() Ozone !?, What is it ? This articile was originaly written by my editor for a science magazine.
It is a good description of what Ozone is.
Ozone !?, What is it ? This articile was originaly written by my editor for a science magazine.
It is a good description of what Ozone is.
Weather Balloons and Atmospheric Science
 Matt from the McMurdo weather station is holding onto a small
weather balloon which they release once a day in the winter time
to check upper atmosphere weather patterns. The small box he has
in his hand which is attached to the bottom of the balloon sends
information about its location back to his office computer.
The things last for a day or two and are effectively disposable
units. The information is limited but essential in creating the
bigger pattern of what is happening to the weather. The balloons
are not filled with to much pressure because as the balloon rise's
,it inflates (gets bigger), as the atmospheric pressure around it
gets lower. The correct amount of helium has to be put into
the balloon. Not to much and not to little, otherwise it may
either pop before it gets high enough into the atmosphere or it
may not have enough helium to get high enough to get the readings
required. In the summer time they would normally release
two balloons per day so that the weather predictions are more
accurate. All the readings along with satellite pictures are used
to give an overall picture and weather forecast.
Matt from the McMurdo weather station is holding onto a small
weather balloon which they release once a day in the winter time
to check upper atmosphere weather patterns. The small box he has
in his hand which is attached to the bottom of the balloon sends
information about its location back to his office computer.
The things last for a day or two and are effectively disposable
units. The information is limited but essential in creating the
bigger pattern of what is happening to the weather. The balloons
are not filled with to much pressure because as the balloon rise's
,it inflates (gets bigger), as the atmospheric pressure around it
gets lower. The correct amount of helium has to be put into
the balloon. Not to much and not to little, otherwise it may
either pop before it gets high enough into the atmosphere or it
may not have enough helium to get high enough to get the readings
required. In the summer time they would normally release
two balloons per day so that the weather predictions are more
accurate. All the readings along with satellite pictures are used
to give an overall picture and weather forecast.
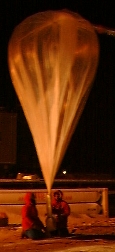 This
balloon is a bit more expensive ( about $10,000 US) and only
released every now and then. it is used for extreme altitude
reading and the units on the bottom send back a comprehensive
amount of information for atmospheric science data collection.
The units also have homing devices built into them and it
allows the expensive unit to be found in the summer and reclaimed.
Before they send this thing up they shot a laser into the sky to
check for certain weather conditions. They do this to make
sure they will have the best possibility of quality data
retrieval. Like the other balloon above. This balloon will
fill out and look like a bloated pig as it gets high into
the atmosphere.
This
balloon is a bit more expensive ( about $10,000 US) and only
released every now and then. it is used for extreme altitude
reading and the units on the bottom send back a comprehensive
amount of information for atmospheric science data collection.
The units also have homing devices built into them and it
allows the expensive unit to be found in the summer and reclaimed.
Before they send this thing up they shot a laser into the sky to
check for certain weather conditions. They do this to make
sure they will have the best possibility of quality data
retrieval. Like the other balloon above. This balloon will
fill out and look like a bloated pig as it gets high into
the atmosphere.
You would have to talk to the science people for more
information on the exact information they get back from the
different types of balloons.
At Scott Base our atmospheric science research scientist Dr Stephen Wood was able to supply me with a few bits of information.
![]() Scott base atmospheric
science logistics report for 1997 and 1998
Scott base atmospheric
science logistics report for 1997 and 1998
![]() Instrumentation used at
Scott Base and a brief explanation of their operation
Instrumentation used at
Scott Base and a brief explanation of their operation
![]() Report on the side effects
of an unstable Polar Vortex
Report on the side effects
of an unstable Polar Vortex
![]() Atmospheric Science Report
Atmospheric Science Report
www.geocities.com/coolrunnernz/
9-3-01
Written by Ray Young
Edited by Shirley Baston Fred [email protected] ICQ # 15167279