May 10, 2008
Hillary thought she would have the nomination locked up by Super Tuesday, Feb.5. The GOP wanted to run against her from the start. They knew that they couldn’t beat Edwards in the GE, so they made sure that he would be out of the race if they got the media to ignore him. But Obama proved to be a much tougher opponent than either the GOP or Clinton ever expected.
So now Clinton and the GOP are doing everything they can to
prop up Hillary and derail Obama. Beginning with her miraculous New Hampshire
“win”, there has been an ongoing effort to pad her votes at Obama's expense.
Rovian tactics are being used to divide and conquer: it’s the only way that
McCain can win. The media does not discuss the many indications of election fraud.
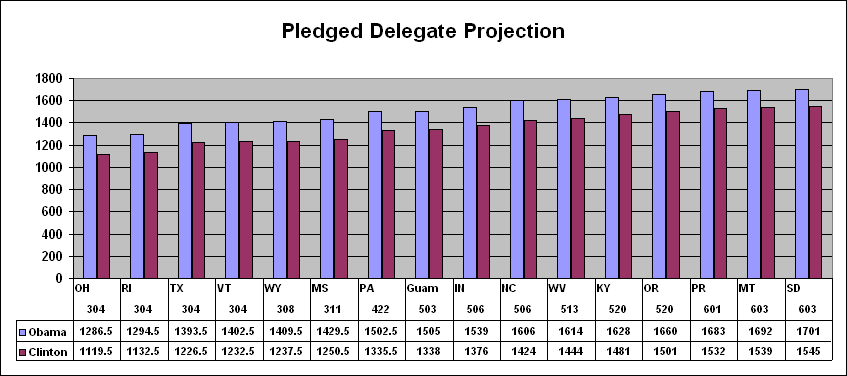
Obama currently leads Clinton by over 700,000 in the
recorded vote and by over 160 in pledged
delegates. But if the exit polls and
caucuses reflect the True Vote, he would be leading by more than 1.5 million
votes. That would make a tremendous difference in his pledged delegate
margin. Obama would be the nominee right now were it not for election fraud.
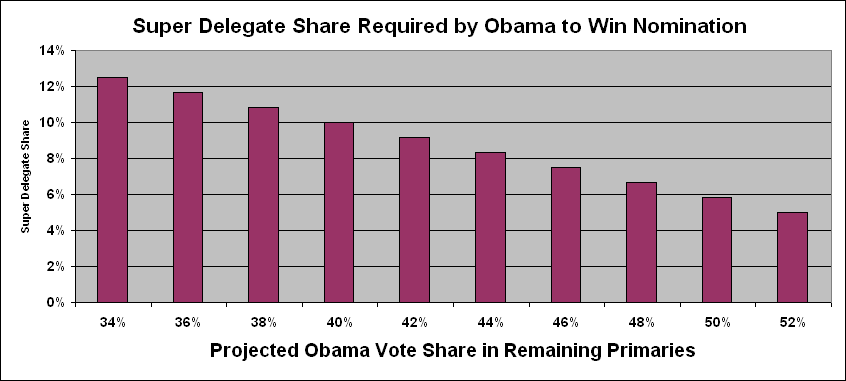
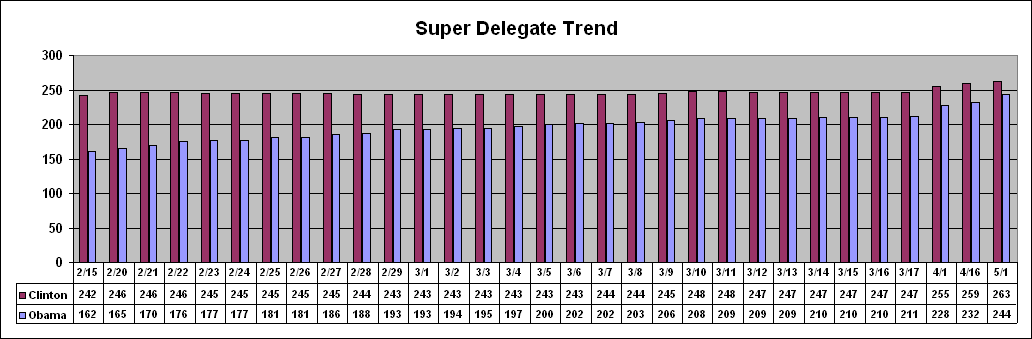
For Clinton to catch Obama in pledged delegates, she needs 93% of the vote in the remaining primaries. But if Obama wins 50%, he will need just 22% of the 256 uncommitted super delegates to clinch the nomination. Since Super Tuesday there has been a steady trend in SDs to Obama.
Exit polls are adjusted to conform with the actual recorded vote tally, even if it is corrupted. The WPE is the difference in the average precinct exit poll margin and the recorded vote margin. In Jan. 2005 exit pollsters Edison-Mitofsky reported that Kerry led the unadjusted exit polls by 51.8-47.2. There was a 7% difference (WPE) between Kerry 4.6% margin and Bush’s 2.4% (50.7-48.3) recorded vote margin.
“Managing Electoral Dynamics via Covert Vote-Count Manipulation”, a June 2008 Scoop article written by Jonathan Simon and Bruce O’Dell for the Election Defense Alliance, comes to similar conclusions regarding the stolen primaries: “We present evidence supporting the hypothesis that systematic attempts are being made to manipulate the results of the 2008 Democratic presidential nomination contest, through overt means such as crossover voting by non-Democrats, and through covert means targeted at the electronic vote tabulation process itself. The net effect has been to prolong the nomination battle and sharpen its negativity, thereby boosting the prospects of the Republican nominee and making more plausible his “victory” in November-either by an honest count or through continued exploitation of the proven security vulnerabilities in American voting systems”.
Primaries,
Caucuses and Exit Polls
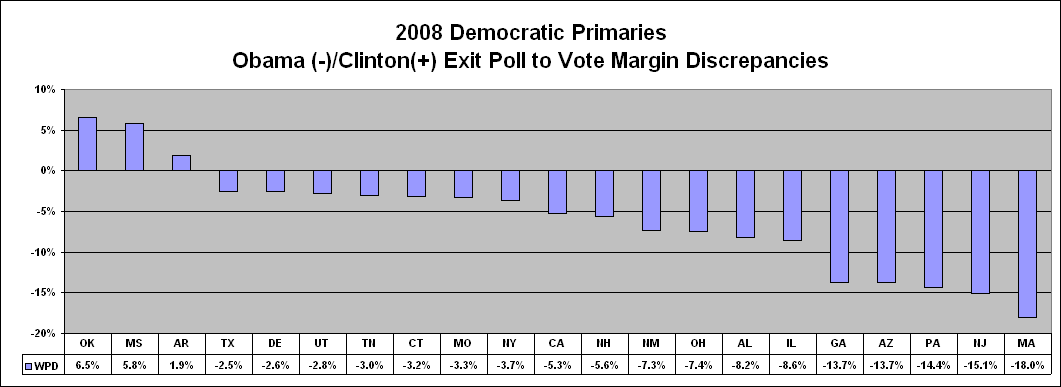
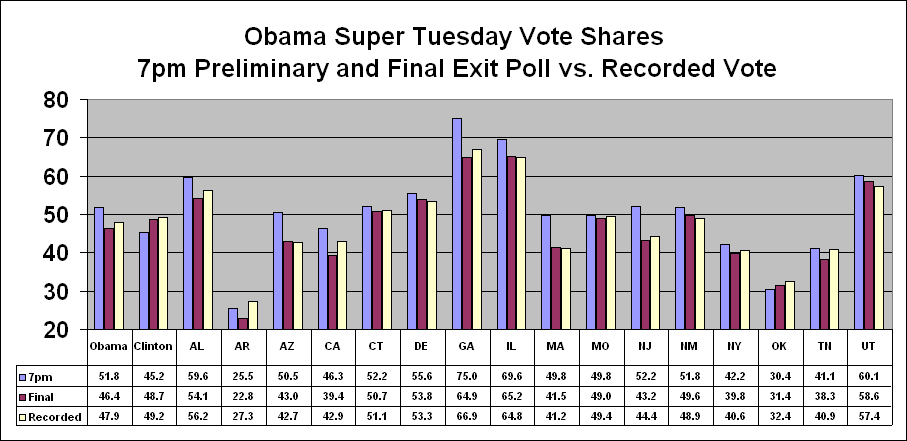
Obama does much better in human-counted caucuses than in machine-counted primaries. Texas is a perfect example. There’s a 30% difference in Obama’s margin between the primaries (49-47%) and the caucuses (66-34%). His recorded vote margin is dwarfed by his lead in the exit polls. But that’s not unexpected; the progressive (i.e. Democratic) candidate always does better in the exit polls than in the vote count due to the endemic fraud: uncounted and switched votes. It’s not due to biased exit polling. Ideally, the exit poll discrepancies would be equally distributed between the two parties. The fact that they always move in favor of the most conservative candidate indicates a pattern of fraud which is beyond a reasonable doubt.
In the 21 primaries which had exit polls:
Obama leads by an average 50.4-45.8% (4.6% margin) in the exit polls.
Clinton leads by an average 48.4-47.1% (1.3% margin) in the recorded vote.
The discrepancy in margin from exit poll to the vote is 5.9%.
The exit poll-to-vote shift favored Clinton in 18 of the 21 states.
The 2.5% Exit Poll MoE was exceeded in 11 of the 18 states.
The margin discrepancy exceeded 13% in 5 states.
The probability that all of these discrepancies would be due to chance is as close to zero as you can get.
Just before the March 4 Texas and Ohio primaries, Rush
Limbaugh called for "Operation
Chaos" to get Republicans to cross
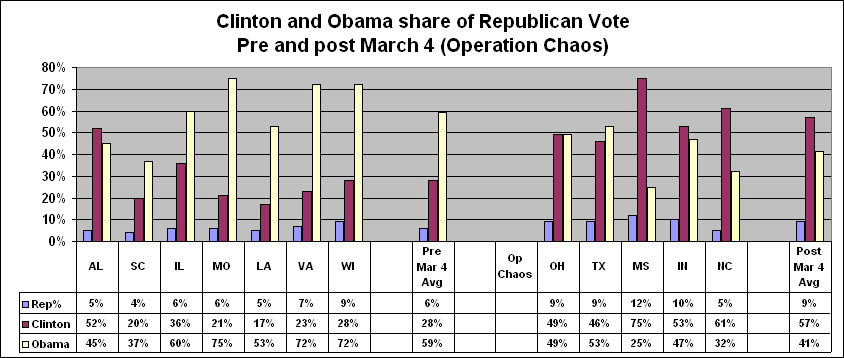
over and vote for Clinton. Since March 4, there have been two sets of Republican crossover voters.
The first set consists of Republican moderates who voted 2-1 for Obama. The
second consists of Operation Chaos Republicans who voted for Clinton. Final
Exit poll data shows that since March 4, the percentage of Republican
crossover voters has increased from 6% to 9%. The change has been totally
to Clinton's benefit. Assuming the first 6% of Republicans voted
59-28% for Obama, the other 3% (150,000) were Operation Chaos crossovers who
voted 100% for Clinton!
Prior to March 4, Obama won the seven primaries in which Republicans participated by an average 57-38% vote. He won the Republican vote by 59-28%.
Since March 4, Clinton has won the average vote by 51-47% and Republicans by 57-41%
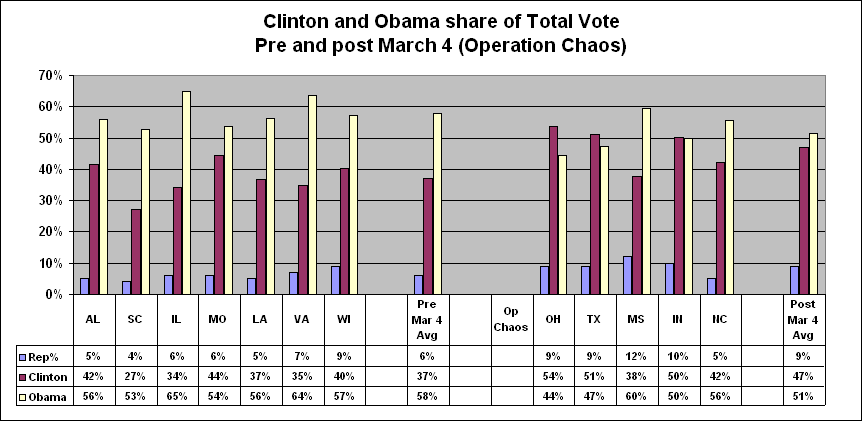
Prior to March 4, Obama won the total vote by 50.1-45.6%.
Since March 4, Clinton is leading by 50.8-47.8%.
Operation Chaos was
one factor which may very well have caused Obama to lose the Texas primary by
51-47%. It definitely caused his 50.6-49.4% defeat in Indiana. Of course, the
effect on pledged delegates was minimal.
The Final pre-election polls (3-4% MoE) gave Obama an average 8% margin over HRC. The early (unadjusted) exit poll had Obama winning by 8%. He won New Hampshire hand-counts by 5.90% but lost machine-counts by exactly the same margin.
Even though he finished third, Edwards would have done better in the general election than either Clinton or Obama.
Just like the 2004 battleground states exit poll red-shift to Bush, Clinton’s recorded vote share in 14 of 16 primaries have exceeded her exit poll share. In New York, over 80 precincts, many in black areas, recorded Zero votes for Obama. Mayor Bloomberg called it fraud. In Los Angeles, 90,000 independent votes were uncounted due to the confusing ballot design (shades of the infamous Florida 2000 “Butterfly” which cost Gore over 3,000 votes).
Clinton's vote share exceeded her 9pm exit poll share by 3.6% (55.2-51.6%). She won the recorded vote by 10.6% (55.3-44.7%) over Obama. But her exit poll margin was just 3.4% (51.7-48.3%). As always, the Final Exit Poll was adjusted to match the vote count. In addition, there is concrete evidence that Republican cross-over voters played a significant role in delivering votes to Clinton. In Cuyahoga County 17,000 Republicans followed Rush Limbaugh’s advice and voted for her. And this was also the case in many other counties.
Texas
There was a strange, impossible result: Zero votes were cast for Republicans in 21 counties (all 36,239 ballots cast were for Democrats). There were zero votes cast for Democrats in 3 counties (all 1865 ballots cast were for Republicans). Did Republicans follow Rush Limbaugh’s advice and cross over to vote for Clinton? We can assume that crossovers, even if not 100%, occurred in other counties.
Mississippi
Obama won by 61-37%, but 25% of Clinton’s votes came from Republicans who followed the advice of Rush Limbaugh. Obama won 65% of Democrats and Independents.
Pennsylvania
Here dirty
tricks caused votes (and pledged delegates) to be stolen from Obama. Hillary
won the recorded vote by 54.7-45.3%. But
100% of the votes were machine-counted. The unadjusted, “pristine” early
exit poll had Obama leading 52-47%. His 5% exit poll margin became a 9%
recorded vote loss. Clinton led the adjusted exit poll by 52-47. The Final exit
poll matched the recorded vote 54-45.
Indiana
The latest media myth is that Rush Limbaugh’s Operation Chaos had no effect on the Indiana primary. Their argument is that the Clinton-Obama (53-47) share of the 10% Republican crossover vote is virtually the same as the split in the total vote. Clinton won by 50.6-49.4%, but Operation Chaos Republican crossovers inflated her vote by 4%. Obama should have been a 51.5-48.5% winner.
The Delegate Calculator is an Excel worksheet model for projecting the total number delegates.