This is an updated response to the “TruthIsAll FAQ” by
Mark Lindeman. Since 2005 Mark has been
posting non-stop trying to debunk the work of scores of independent election
analysts. The analysts cite pre-election and exit polls as powerful evidence
that Kerry easily won the True Vote in 2004 and that the 2006 Democratic
landslide was denied by election fraud.
Posting as ‘On the Other Hand’ on the Democratic Underground and ‘Hudson
Valley Mark’ on Daily Kos as well on and numerous other forums, Mark quickly
responds to posts that analyze pre-election and exit polls, and invariably
thrashes them if they are used as indicators of election fraud. It’s good that Mark wrote the TIA FAQ for it
provides a snapshot summary of the polling debates which are still taking place
on various election forums.
Confirmation
of a Kerry Landslide is a complete analysis of the 2004 election.
2008
Election Fraud Analytics shows that although Obama won by 9.5 million
recorded votes, his True Vote margin probably exceeded 20 million. Just like in
the 2006
Midterms, a Democratic landslide was denied.
Election
Fraud Analytics is another comprehensive statistical analysis of the 2004
and 2006 elections. In 2000, Al Gore
won by several million more votes than his recorded 540,000 margin. In 2004,
John Kerry actually won by 8-10 million votes. In the 2006 midterms, a
Democratic Tsunami gave them control of congress, but the landslide was
denied; they did much better than the official results indicate. And the
True Vote does not include the disenfranchised, the great majority of whom are
Democratic minority voters.
The original TruthIsAll (TIA) FAQ was written
in late 2006 by Mark Lindeman, an Assistant Professor of Political Science.
Since 2004, Mark has frequented election reform sites, relentlessly attempting
to rebut the polling analyses of researchers that indicate elections have been
stolen since 2000. “On the Other Hand”,
his Democratic Underground screen name, is apropos to his mission.
In January 2007, I wrote "Response to
the TruthIsAll FAQ" along with a detailed statistical analysis:
"2000-2006 Election Fraud Analytics". Now that the 2008 election is
history and similar anomalous results indicate that election fraud cut Obama’s
landslide in half, just like the Democratic margin was in the 2006 midterms.
Furthermore, the 2008 results confirm that the 2004 election was stolen and
that Gore won the popular vote in 2000 by close to 3 million.
Most election researchers agree that the
election was stolen in 2004. But
statistical evidence also indicates that election fraud cut the 12% Democratic
landslide margin to 6% in the 2006 midterms, costing them 10-20 House seats and
that Obama’s True Vote mandate was reduced from approximately 20 million to 9.5
million.
That is what the evidence shows, regardless
of whether or not it is ever discussed in the media. Statistical analysts and
political scientists who have looked at the evidence are well aware of the
fraud, but are still waiting for the Democratic politicians and the GOP
controlled media to get the ball rolling. In the meantime, only a handful of
bloggers and truth-seekers will even touch the subject. A number of books have
been written which show that massive fraud in the form of voter
disenfranchisement and vote miscounts occurred in 2000-2008, but not one that
provides a statistical analysis to prove that Bush won in 2004.
In order to help the reader quickly become
familiar with the main areas of focus, I have included a brief summary of the
questions posed to Mark in the original FAQ – along with a short update summary
of his response followed by mine. The original full text response follows the
summary.
A TruthIsAll (TIA) FAQ
by Mark Lindeman
TruthIsAll (TIA) is the pseudonym of a former Democratic Underground (DU) regular who now posts elsewhere. Many of his writings are available at http://www.truthisall.net. TIA argues, among other things, that the 2004 U.S. presidential pre-election polls and the exit polls both indicate that John Kerry won the election.
Who is TruthIsAll (TIA) and why do you care what he says?
I don't know who he is. Apparently he has worked in quantitative analysis for many years; he has described himself as an "Excel expert." His allegations of election fraud -- in particular, his enumeration of (presumably far-fetched) things one must believe in order to believe that Bush won the 2004 election -- formed the template for the 2005 Project Censored story making the same case.
Many people believe that TIA's arguments irrefutably demonstrate that John Kerry won the popular vote and the election. Many more people believe that TIA's arguments have no merit whatsoever, and therefore don't bother to try to refute them. I do not like to see weak arguments go unchallenged. (But plenty of people have criticized TIA's arguments -- I make no claim to originality.)
I also think that these particular weak arguments lead to poor political judgments. If TruthIsAll is right, it follows that the 2004 election was obviously stolen. So, one might conclude, among other things, that (1) most voters preferred Kerry to Bush, (2) Democratic political leaders are effectively complicit in a cover-up, and (3) Democrats cannot win crucial elections until and unless the current voting systems are thrown out. I disagree with all of these conclusions.
(Now that the Democrats have won House and Senate majorities in the 2006 election, argument #3 must be modulated. Fraud-minded observers now often argue that the Republicans stole some votes and even some seats, but that either for some reason they could not -- or did not dare? -- steal enough vvotes, or that they had to decide how many votes to steal several weeks in advance, and were caught flat-footed by a late Democratic surge. As I address on the Miscellaneous page, I have seen no convincing evidence of widespread vote miscount.
OK, so what are TIA's arguments?
He has many posts, but many of them make these basic claims:
Pre-election polls (both state and national) gave Kerry better than a 99% chance of winning the election.
Well-established political generalizations, such as the "incumbent rule," buttress the conclusion that Kerry should have won.
The exit polls gave Kerry a lead in the popular vote well beyond the statistical margin of error, and diverged substantially from the official results in many states, generally overstating Kerry's vote total. (This claim is largely true, although not everything TIA says about it is.)
Fraud is the only good explanation of the exit poll discrepancies. In particular, there is no good reason to believe that Kerry voters participated in the exit polls at a higher rate than Bush voters. Since Kerry did better than Bush among people who did not vote in 2000, Bush would have had to do much better among Gore 2000 voters than Kerry did among Bush 2000 voters -- and that can't have happened.
It is pretty easy to look around and determine that not many political scientists are expressing agreement with these views. But why not? It could be that political scientists have a status quo bias and/or are afraid to rock the boat by confronting unpleasant truths; perhaps some are even paid by Karl Rove. It could be that political scientists simply haven't looked at the evidence. It could be that political scientists see gaping holes in TIA's arguments. It could be some combination of those factors, and others besides. For what it's worth, I will explain at some length why I don't agree with TIA's views.
Please note that this is not a one-size-fits-all election integrity FAQ.
Do you think that electronic voting machines are almost ridiculously
insecure and unreliable?
I do, although I certainly don't agree with every word of every critic. Do you think that John Kerry won or should have won Ohio? You may be right. I don't know. I doubt it, but I haven't set out to knock down each and every argument about fraud or vote suppression in the 2004 election -- in fact, I agree with several of them. But the arguments (by TIA and others) that Kerry won the popular vote are not at all likely to be true, in my opinion.I have rarely quoted TIA at length because (1) the FAQ is already very long and (2) TIA's writing is often hard to read. But if you think I have mischaracterized one of his arguments, or if you have other questions or comments about the FAQ, please feel free to contact me at [my last name]@bard.edu.
TIA:
These are just a few well-known researchers whose analyses confirm mine: Steve Freeman, Ron Baiman, Kathy Dopp, Greg Palast, RFK Jr., Mark C. Miller, Bob Fitrakis, Michael Keefer, John Conyers, Richard Hayes Phillips, Paul Lehto, etc. At least four have advanced degrees in applied mathematics or systems analysis. I have three degrees in applied mathematics.
It would be useful if you would mention the names of the political scientists or statisticians who disagree with my analysis and believe that Bush won the election fairly in 2004. How do they account for his 3 million “mandate”? How do they explain where Bush found 16 million new voters net of voter mortality and turnout? What are their confirming demographics? Do any of the analysts you refer to have degrees in mathematics or statistics? Did their 2004 projections match the exit polls? Or did they match the vote miscount? Have any of them ever written about or considered election fraud in their analysis? Have they analyzed the impact of uncounted votes on election results? What is their track record? Were their projections based on economic or political factors or did they use state and national polling? What was the time period between their final projections and Election Day?
FAQ Summary and Response
1. The Pre-Election Polls
1.1. What did the national pre-election polls indicate?
According to most observers, most pre-election polls put George W. Bush slightly ahead of John Kerry.
TIA: That is simply not true. Real Clear
Politics is often cited as the data source but it is misleading since it
only lists final LV polls and the full RV sample. The final five
pre-election polls from CBS, FOX, Gallup, ABC, and Pew had the race essentially
tied. Kerry led the five-poll RV average 47.2-46.0; Bush led the LV average
48.8-48.0. Gallup's RV sample had Kerry leading 48-46; the LV subset had Bush
leading by 49-47. Gallup allocated 90% of the undecided vote (UVA) to the
challenger, so their final prediction was 49-49.
The final five LV samples predicted an average 82.8% voter turnout, but
according to post-election Census data, turnout was 88.5%. A regression analysis indicated that Kerry
had 48.9% given the 82.8% prediction or 49.3% assuming he had 75% of undecided
voters (UVA). But he had 51.3% given the 88.5% turnout or 52.6% with a 75% UVA. Kerry did 2-3%
better in the full RV sample since a solid majority of newly registered voters
were Democrats.
http://www.geocities.com/electionmodel/index_files/ElectionModel_9609_image008.png
http://www.geocities.com/electionmodel/RCP2004_17095_image001.png
2008 Update: Pre-election
RV polls had Obama leading by 52-39%.
He led the LV subsets (the only ones listed at RCP) by 50-43%.
Neither average includes an allocation
of undecided voters.
1.2. How does TIA come up with those 99+% probabilities of a Kerry
victory?
Basically, those probabilities (for both state and national polls) assume that all his assumptions (for instance, about how "undecided" voters will vote) are right, and that the only source of uncertainty is random sampling error.
TIA: The 2004 Election Model assumed a final 75% undecided voter allocation (UVA) percentage; but provided scenarios ranging from 60-87%. A 5000 trial Monte Carlo EV simulation gave Kerry a 98.0% win probability assuming 60% UVA (99.8% for the base case 75% UVA).
The base case assumption was that Kerry would win 75% of the undecided vote.
But a sensitivity analysis showed that he won with 50%.
Historically challengers have won the undecided vote over 80% of the time.
Gallup assigned 90% of undecided voters to Kerry.
There were approximately 22 million new voters. Kerry won this group by 3-2.
There were 3 million defecting third-party (Nader) voters. Kerry won this group by better than 3-1.
http://www.geocities.com/electionmodel/index_files/ElectionModel_9609_image004.png
2008: The Final 2008
Election Model forecast exactly matched Obama’s 365 EV and was just 0.2%
higher than his recorded 52.9% vote share. Obama won all 5000 scenarios – a
100% win probability. But his True EV and popular vote were both higher. The
final national projection was based on the 50-43% LV poll average. The LV polls
understated Obama’s vote share. He led by 52-39% in the final RV polls-
before undecided voters (7%) were allocated. After allocation, Obama led by
57-41%. Obama’s (expected) EV was calculated as the cumulative sum of each
state’s poll-based win probability multiplied by its electoral vote. The 5000
election trial Monte Carlo simulation produced a mean 365.8 EV, illustrating
the Law of Large Numbers (convergence to the theoretical expected value).
1.3. Doesn't the high turnout in the election mean that the
registered-voter poll results are probably more accurate than the likely-voter
results?
No, high turnout is not a reason to dismiss the likely-voter results. Most pollsters already expected high turnout.
TIA: The average
projected turnout of registered voters in the final five LV polls was
82.8%; the Census turnout estimate was 88.5%. A regression analysis of turnout
vs. vote share showed that Kerry had 49% assuming 82.8% turnout and 52.6%
assuming 88.5%. The full RV poll sample was more accurate then the LV subset
since it includes many newly registered voters that the LV polls filtered
out. The high turnout meant that many
new (i.e. Democratic) voters were missed by the LV polls and therefore they
understated Kerry’s projected share. In 2004, there were approximately 22
million newly registered and others who
did not vote in 2000. Kerry won this group by 57-62% , depending on the
National Exit Poll time line. In the Final NEP (13,660 respondents) which
was forced to match the recorded vote, the exit pollsters reduced Kerry’s DNV
share to 54% and widened the returning Bush/Gore voter mix to 43/37% from
41/39% at 12:22am (13047 respondents).
2008: RV polls adjusted for a 75% UVA matched Obama’s True vote (57%), calculated in True Vote Model based on a feasible returning voter mix and Final 2008 NEP vote shares.
1.4. How about the state polls?
There TIA's data hold up somewhat better, although his probabilities don't. While the national polls (prior to TIA's massaging) fit the official results rather closely, the state polls do not fit as well.
TIA: Professional pollsters must be “massagers” as well, since they also known allocate undecided voters. Final RV polls, with 75% of undecided voters allocated to Kerry, did in fact confirm the unadjusted state aggregate exit poll (he was a 52-47% winner). Tim Lorentz did a 2004 pre-election poll analysis.
Fact - Kerry had a 1% lead in the final pre-election polls before undecided voters were allocated; he led by 3% after allocation.
Fact - Kerry led Register Voter polls by a higher margin than Likely Voter polls.
Fact - Registered Voter pre-election polls were more accurate than LV polls.
Fact - There were 22 million new voters. Kerry won 57-60% of new voters.
http://www.geocities.com/electionmodel/index_files/ElectionModel_9609_image001.png
http://www.geocities.com/electionmodel/index_files/ElectionModel_9609_image005.png
2008: Allocating 75% of undecided votes to Obama, the aggregate final state pre-election polls gave Obama 53.8%. But they were LV polls; the RVs gave him 56-57%
1.5. What about cell phones?
TIA and others have argued that the pre-election polls were biased against Kerry because they do not cover people who only use cell phones -- and these were disproportionately young voters who favored Kerry.
TIA: True. Young people are heavily Democrats and cell phone users.
2008: There were many more
cell-phone users than in 2004. That is just one reason why Obama did better in
the RV polls.
The "Rules": Did They Favor
Kerry?
2.1. Don't undecided voters break sharply for the challenger?
Undecided voters probably sometimes break sharply for the challenger. But I can find no evidence that this rule is useful in "allocating" reported undecided voters in presidential elections.
TIA: Not sometimes; virtually always. If they liked the incumbent they would not be undecided. There is no evidence that allocation is “useful”? What is the basis of your statement? Professional pollsters find allocating undecided voters is quite useful. Gallup allocated 90% of undecided voters to Kerry. Zogby and Harris 75-80%.
2008: Six pollsters who allocated an average 67% of the undecided vote to Obama.
2.2. What about the rule that incumbents don't do better than their
predicted shares in the final polls?
On average, it is true that incumbents don't do better -- or, rather, much better -- than their predicted shares in the final polls.
TIA: That is a contradiction. Since you agree
that incumbents don’t do better than their final predicted shares, then you
must also agree that undecided voters break for the challenger. If they
broke for the incumbent, he would have a higher vote share than his final
polling. Therefore, how can you say that Bush led the final polls? Bush led
the final LV polls by 47-46, before undecided voters, but Kerry led the final
RVs by 48-47. Since undecided voters broke 3-1 for Kerry, his pre-election
51-48 projected share was confirmed by the state exit poll aggregate (52-47)
and the 12:22am National Exit Poll (51-48).
2008:
Obama was the de facto challenger since McCain represented a continuation of
Bush policies.
2.3. What about the rule that incumbents don't win when their final
approval rating is below 50%?
TIA has stated that Bush's approval rating on November 1 was 48.5% based on the "average of 11 polls."
TIA: That is true. You can look up his monthly approval ratings in the 2004 Election Model.
In every election since 1972, the incumbent won re-election when his approval rating exceeded 50%.
Bush was the ONLY incumbent with approval below 50% to win re-election!
Bush monthly pre-election approval was strongly correlated to the national polls.
Average incumbent approval EXACTLY matched the average True vote (46.5%)!
http://www.geocities.com/electionmodel/Poll2004Comparison_12443_image001.png
http://www.geocities.com/electionmodel/BushRatingStates_5318_image001.gif
http://www.geocities.com/electionmodel/VoteVsApprovalRegression_7284_image001.gif
2008: On Election Day, the Bush
approval rating of 22% indicated that a major Obama landslide was in the
making.
Describing the Exit Poll Discrepancies
3.1. How do the exit polls work?
Let me say first of all that the main point of the exit polls is not to project who will win the election -- although the exit poll interviews are combined with vote count data in order to make projections.
TIA: The unadjusted exit polls work just fine – until the category weights and/or vote shares are forced to match the recorded vote. That makes no sense at all. For one thing, this standard practice assumes that the election is fraud-free. In order to force the Final National Exit Poll to match the recorded vote in 2004, 2006 and 2008, the NEP required an impossible return voter mix and/or implausible vote shares. Most people know that the 2004 election was not fraud-free but are unaware that fraud was just as massive in the 2006 midterms and 2008. In both elections, landslides were denied.
2008: The Final 2008 NEP contains
impossible returning voter weights. Unadjusted state exit polls and preliminary
NEP results have not, and apparently will not be released.
3.2. How accurate are exit polls?
It depends, of course. Most attempts to argue that exit polls are highly accurate strangely steer around U.S. national exit polls.
TIA: Unadjusted exit polls are quite accurate. Respondents report
their vote; there are no undecided voters. On the other hand, the Final
National Exit Poll is grossly inaccurate, since it is always forced to match
the recorded vote, even if fraudulent.
2008: We don’t have the preliminary
national exit poll timeline or the unadjusted state exit polls. Why not? Perhaps because they would show that Obama
did much better than the recorded vote indicates. Can’t have a repeat of 2004;
discrepancies will need to be explained.
3.3. Couldn't spoiled ballots and/or fraud account for these past
discrepancies?
Probably not, although they certainly may contribute. Greg Palast offers an estimate of 3.6 million uncounted ballots in 2004 alone.
TIA: May contribute? They sure do
contribute. The best evidence indicates that 70-80% of uncounted
votes are Democratic. In 2004, the Census reported 3.45 million uncounted
votes. This was confirmed by government statistics (see Greg Palast). Had they been counted, the Bush margin would
have been reduced from 3.0 to 1.3 million. But miscounted votes (switched,
stuffed ballots) accounted for most of the discrepancies. In 2000, the Census
reported that there were 5.4 million uncounted votes, reducing Gore’s margin
from approximately 3.0 million to 540,000.
In every election there are millions of net uncounted votes
(uncounted less stuffed ballots).
Net Uncounted Votes = Total Cast – Total Recorded
In order to match the recorded vote, the Final National Exit Polls
in 1968, 1988, 1992, 2004 and 2008 required that returning Nixon and Bush voter
turnout exceed 100% (i.e. there were millions of phantom voters).
Assuming total votes cast and
feasible returning voter turnout, average historical Democratic True Vote share
exceeded the official share by 4.7%.
http://www.geocities.com/electionmodel/TrueVoteElectionCalculator614test_26851_image001.gif
http://www.geocities.com/electionmodel/RecursiveTrueVoteModel6808_31026_image001.gif
http://www.geocities.com/electionmodel/RecursiveTrueVoteModel6808_8076_image001.gif
http://www.geocities.com/electionmodel/RecursiveTrueVoteModel6808_8143_image001.gif
2008: The
Vote Census has not yet been released.
3.4. What about exit pollster Warren Mitofsky's reputation for
accuracy?
Here is how Mitofsky International's website puts it: "[Mitofsky's] record for accuracy is well known”.
TIA: The Final National Exit poll is always “perfect” because it is always forced to match the recorded vote. But it needed an impossible returning voter mix to match the 2004 recorded vote -no matter that the recorded vote was fraudulent. The unadjusted state aggregate exit poll had Kerry winning by 52-47%; it closely matched the UVA-adjusted pre-election polls. Either way, the exit polls were quite accurate – even though they were polar opposites.
2008: The Final NEP was once
again forced to match the recorded vote with an impossible returning voter mix.
3.5. Didn't the exit polls indicate that Kerry won by more than the
polls' margin of error?
It depends on what one means by "the exit polls" and "won."
TIA: Hmm… the question should be asked: In how many states did the
unadjusted exit poll exceed the margin of error? The MoE was exceeded in 29 states – all in Bush’s favor. The
probability is ZERO. Among the 29 were Ohio, Florida, NM, Iowa and Colorado.
All flipped from Kerry to Bush. The
question should be: how come not ONE solid Bush state exceeded the margin of
error? Two reasons: 1) they were already in the bag and 2) other than Texas, none were candidates for vote padding
since they had small voting population.
2008:
Still waiting for the E-M 2008 report. It’s over a month late. Why?
3.6. Why are the pollsters' estimates of uncertainty larger than the
ones calculated by TruthIsAll and others?
TruthIsAll sometimes has argued that the exit polls should be treated as simple random samples (like drawing marbles from a hat). In this instance, the margin of error for Ohio, with a reported sample size of 2040, would be about 4.5 points on the margin using the 95% standard.
TIA: The Ohio exit poll MoE was 2.2%. Exit pollster notes to the National Exit Poll (13047 respondents) indicate that voters were randomly selected as they exited the voting booth and that the MoE was 1.0%.
http://www.geocities.com/electionmodel/exitpolls_us_110204.gif
2008: The Final NEP had over 17,000
respondents; the theoretical MoE was lower than 1.0%
3.7. Doesn't E/M's own table show that the margin of error is
plus-or-minus 1% for 8000 respondents or more?
That table (on page 2 of the national methods statement) applies to percentages in the tabulations, not to the vote projections.
TIA: The 1.0% MoE applies to the projected vote share for any given category cross tab in which at least 8000 have been sampled. There were 13,047 respondentsd. The MoE was 0.86% assuming a 50/50 poll split. For a 30% cluster effect, it was 1.12%. In the “Voted in 2000” category, 3200 were polled; the MoE was 1.73%. As vote shares diverge from 50/50, the MoE declines. For a 60/40 new voter split, the MoE was 1.70%. For returning Bush and Kerry voters, the 90/10 split has a 1.04% MoE.
3.8. Doesn't everyone agree that the exit poll results were outside the
margin of error?
Yes: overall, and in many states, the exit poll results differed from the official results by beyond the margin of error, overstating Kerry's performance.
TIA: It is more accurate to say that the official vote understated Kerry’s True Vote. The Edison-Mitofsky Evaluation of the 2004 Election System reported than the MoE was exceeded in 29 states – all in favor of Bush.
2008: The report has not been made available. It appears that it never will be. The MSM does not want a repeat of 2004. Probably because it would confirm that the National Exit Poll adjusted for a feasible returning voter mix indicates that Obama won by at least double the official margin.
3.9. Aren't survey results far outside the margin of error prima
facie evidence of fraud?
Margins of "error" refer to random sampling error. Most survey researchers would say that results outside the calculated margin of error most likely evince non-sampling error in the survey, such as non-response bias, sampling bias, or measurement error.
TIA: They evince non-sampling error? What about a vote count? Did they evince fraud? Or is that inconceivable?
3.10. Which states had the largest exit poll discrepancies? Wasn't it
the battleground states?
No, the largest exit poll discrepancies were generally not in battleground states.
TIA: The largest exit poll discrepancies by vote count were in Democratic strongholds: New York and California. The NY discrepancy accounted for 750,000 of Bush’s total 3.0 million margin. Kerry won the unadjusted exit poll by 64-35%; the margin was reduced from 29% to 18% in the recorded vote (58.5-40%). The overall WPE was higher in the battleground states; the lowest WPEs were in strong Bush states.
2008: Unadjusted exit poll results are not available.
The Urban Legend that Bush GAINED vote share from 2000 to 2004 in DEMOCRATIC urban locations is a myth.
His recorded vote share increased as a result of election fraud.
Bush LOST share in REPUBLICAN rural areas and small towns.
The strong 0.61 CORRELATION between county size and percentage increase in the recorded Bush vote debunks the Urban Legend myth.
http://www.geocities.com/electionmodel/TIACountyVoteDatabase_24111_image001.gif
http://www.geocities.com/electionmodel/TIACountyVoteDatabase_14517_image001.gif
http://www.geocities.com/electionmodel/2004UrbanLegend_10764_image001.png
Explaining the Exit Poll Discrepancies
4.1. How did the exit pollsters explain the discrepancies in 2004?
In the Edison-Mitofsky Evaluation of the 2004 Election System, they stated Within Precinct Error was "most likely due to Kerry voters participating in the exit polls at a higher rate than Bush voters".
TIA: How did they know that? What data did they base it on? It’s a myth. Could the 6.5% average WPE have simply been due to the fact that there were more Kerry voters? How does E-M explain the mathematically impossible 43/37% returning Bush/Gore voter mix in the Final National Exit Poll? They can’t have it both ways. The Final NEP was forced to match the miscounted recorded vote.
2008: New election, same anomaly.
This time it’s 46/37%.
4.2. What is the "reluctant Bush responder" (rBr) hypothesis?
What the pollsters concluded in the evaluation report was simply that Kerry voters apparently participated at a higher rate.
TIA: That was a trial balloon immediately floated by the exit pollsters to explain the discrepancies but they had no data to back it up. In fact, the report suggested otherwise; there was a slight Bush bias. But no one in the media called them on it. The rBr canard was contradicted by the Final National Exit Poll. A mathematically impossible Bush/Gore 43/37 returning voter mix was required to match the vote count. Unfortunately few read the report.
The Final National Exit Poll indicated that returning Bush voters comprised 43% of the electorate; just 37% were Gore voters.
Bush needed 55% of non-responders to match his vote. He had 47% of responders.
Exit poll response was HIGH in strong Bush states and LOW in Kerry states.
http://www.geocities.com/electionmodel/ProbMajVote_18791_image001.gif
http://www.geocities.com/electionmodel/RBRProbSENS_22629_image001.png
http://www.geocities.com/electionmodel/StateVotevsExitPollCompletionRate1_27680_image001.gif
2008: Expect the same tired canard:
Democratic voters were more anxious to speak to the exit pollsters, blah, blah,
blah…
4.3. Does the participation bias explanation assume that fraud is
unthinkable?
I will present several lines of argument that participation bias accounts for much of the exit poll discrepancy, and that fraud does not.
TIA: Do the “lines of argument” include data from the E-M report that indicates Bush voters participated more readily?
The change in Bush recorded vote share from 2000 to 2004 is an incorrect measure of Swing.
Swing should be based on total votes cast (i.e. the True Vote).
The correlation between TRUE vote swing and recorded Red-shift was a strongly NEGATIVE –0.44.
Correlation Summary:
Recorded Swing vs. Recorded Red-shift: -0.05
True Swing vs. True Red shift: -0.34
Recorded Swing vs. True Red-shift: -0.56
Kathy Dopp of U.S. Count Votes proved that it is not NECESSARY that there be a CORRELATION for fraud to occur; the assertion was logically false.
Fact - In 2000 there were 110.8 million votes cast and 105.4 million recorded.
Fact - In 2004 there were 125.7 million votes cast and 122.3 million recorded.
Fact - From 70-80% of uncounted votes were for Gore and Kerry.
http://www.geocities.com/electionmodel/TrueVoteElectionCalculator614test_10497_image001.gif
http://www.geocities.com/electionmodel/TrueVoteElectionCalculator614test_image001.gif
2008: Expect the “swing vs. red-shift: canard to be used again. But as in 2004, “swing” in 2008 will assume a fraud-free 2004.
In any case, the premise has been
proven logically false, since it is easy to display scenarios that disprove it.
4.4. Don't the high completion rates in "Bush strongholds"
disprove the rBr or bias hypothesis?
No, and I'm amazed how much mental effort has gone into elaborating this very weak argument.
TIA: Amazed that a regression analysis shows completion rates declined moving from Bush to Kerry states?
The analysis is a “strong” argument and the Kerry Vote vs. Exit Poll Completion graph clearly shows the pattern.
2008: The E-M report has not yet
been released. Why? It will surely show the same regression trend.
4.5. How can you explain the impossible changes in the national exit
poll results after midnight?
As I explained above, the tabulations are periodically updated in line with the projections -- and, therefore, in line with the official returns.
TIA: But what if the tabulations were corrupted by official vote miscounts? Based on the 2000 overt election theft, matching to the recorded vote count in 2004 requires a major leap of faith that Bush had neither motive, means or opportunity to steal the election.
2008: The preliminary NEP has not
been released. Why?
4.6. Why were the tabulations forced to match the official returns?
If the official returns are more accurate than the exit polls -- and bear in mind that exit polls have been (presumably) wrong in the past -- then weighting to the official returns should, generally, provide more accurate tabulations.
TIA: Presumably? That’s a big IF. One cannot just assume that the exit polls were wrong in the past. For one thing, we know that at least part of the discrepancies in every election since 1968 can be explained by millions of uncounted votes.
2008: The Final is once again using
impossible returning Bush/Kerry/Other weights (46/37/4%). The Bush 46% (60.2m)
share is impossible; there were at most 57m returning Bush voters – if you
assume he had 62 million recorded (i.e. bogus) votes in 2004. The returning
third-party 4% (5.2m) share is impossible; there were only 1.2 million recorded
third party votes in 2004.
4.7. Wasn't there an effort to cover up the exit poll discrepancies?
Not that I can see.
TIA: You fail to see because you refuse to consider the preponderance of the evidence. Either that or you aren’t looking hard enough. The National Exit Pool mainstream media have not provided raw, unadjusted precinct data for peer review. When pressured to provide Ohio exit poll data, they “blurred” the data by not divulging the precincts. A comprehensive analysis by USCV indicated a solid Kerry 6-8% margin. Of course, the MSM has never discussed this.
2008: There is obviously an ongoing, recurring effort to cover up the fraud. Just look at the NEP.
4.8. Is there any specific reason to think that the exit poll
discrepancies don't point to fraud?
One of my favorites is based on TruthIsAll's observation: "Based on the pre-election polls: 41 out of 51 states (incl DC) deviated to Bush. Based on the exit polls: 43 out of 51 deviated to Bush."
TIA: How can the margin of error be exceeded in 29 states, all in
favor of Bush, not be an indicator of massive fraud? How can forcing the Final
NEP to match the vote count (using impossible weights and implausible vote
shares) not be an indicator of fraud? How can the pre-election state and national pre-election polls
indicate a 51-48% Kerry victory, confirmed by the unadjusted state exit poll
aggregate (52-47%) and the 1222am National Exit
Poll (51-48%), not indicate
fraud? How can the results of pre-election and post-election polls of over
150,000 respondents indicate that Kerry was the winner not indicate fraud?
After adjusting for undecided voters, the pre-election state and
national polls matched the corresponding unadjusted exit polls.
http://www.geocities.com/electionmodel/InteractiveElectionSimulation_12255_image001.png
http://www.geocities.com/electionmodel/DEVPreActExitAct_11313_image001.png
2008: The
unadjusted state exits have not been released. They will surely show a similar,
implausible red-shift to McCain from the exit polls.
4.9. Is there any specific reason to believe that participation bias does
explain the discrepancies?
Yes, beyond the facts that
participation bias is common, that past exit polls have overstated Democratic
performance, and that the exit poll discrepancies don't correlate with
pre-election poll discrepancies, "swing" from 2000, or electronic
voting machine use, there is also some evidence indicating participation bias
in 2004.
TIA: But what if the discrepancies were due to uncounted and miscounted votes. Democrats always do better in the exit polls than the recorded vote because a) 70-80% of uncounted votes are Democratic, b) vote-switching and c) ballot stuffing. The premise of “swing vs. red-shift” is that the 2000 recorded vote closely matched the True Vote, but at least 5.4 million (net of stuffed) ballots were never counted. Therefore “swing” from 2000 to 2004 is based on a false premise and must be immediately rejected. Besides, there are an infinite number of scenarios that refute the argument. The “swing vs. red-shift” canard is pure double-talk designed to confuse. It was debunked by Kathy Dopp at US Count Votes in a mathematical proof.
2008: The media is sure to use the same, pathetic bias argument that Democratic voters are more likely to be exit-polled – among other things.
4.10. Aren't you offering a lot of unproven speculation?
You could call it that, or you could call it scientific reasoning on the basis of incomplete evidence.
TIA: The evidence is overwhelming. What is clearly evident is that you have seen more than enough evidence but refuse to accept any of it.
2008: Even with more evidence of fraud in the impossible 2008 Final NEP, Mark still invokes rBr and “false recall”.
4.11. Are you saying that the exit polls disprove fraud?
No. As noted earlier, many forms of fraud may be compatible with the exit poll results. However, it seems hard to reconcile massive, widespread fraud – on the order of many millions of miscounted votes -- with the exit poll results unless one begins by discounting the details of the exit poll results.
TIA: What constitutes “massive” fraud? A 5-7% vote
switch is very possible with unverifiable touch screens and invisible central
tabulators. Uncounted votes accounted for over half of Bush’s 3 million
“mandate”. There were 125.7 million votes cast in 2004 and 110.8 million in
2000. Approximately 5.8 million died. Of the 105 million still living, approximately
102 million voted in 2004. Therefore there were 24 million new voters and 3
million returning Nader voters. How did they vote? Of the 27 million, Kerry had
approximately 16 million (60%) – a 5 million margin. Gore won the popular vote
by 540,000. So how did Bush turn a 5.5 million deficit into a 3 million
surplus? That’s an 8.5 million net vote switch. Are we to believe that 8.5
million more Gore voters defected to Bush than Bush voters to Kerry? That is
beyond implausible.
2008:
And now we are expected to believe there were 12 million more returning
Bush than Kerry voters?
4.12. Are you saying that you are sure Bush didn't steal the election?
No,
depending on what one means by "steal." In particular, I think it is
at least possible that some combination of vote suppression (purges, long
lines, intimidation, etc.) and uncounted votes cost John Kerry a victory in
Ohio, and therefore in the election. (Obviously "uncounted votes" can
be regarded as a form of vote suppression.) I doubt it, but I am not arguing
against it here.
TIA: There you go, refusing once
again to even consider the probability that votes were miscounted
electronically. After all the anecdotal evidence of vote miscounts, you still
only go as far as to suggest “vote suppression” and uncounted votes, but do not
consider the very real probability that votes were miscounted at the touch
screens and central tabulators. Let’s get real. Why would election
officials use visible vote suppression but not resort to invisible,
unverifiable electronic vote switching and other surreptitious methods?
2008: A new election and still the same unverifiable voting machines. It’s a repeat of the 2006 Democratic Tsunami. Landslide denied.
Comparing 2004 to 2000
5.1. Why has TruthIsAll called the "2000 presidential vote"
question the clincher?
TIA emphasizes two aspects of this table. First, he notes, it is impossible that 43% of the 2004 electorate voted for Bush in 2000. That would be over 52 million Bush voters, whereas Bush only got about 50.5 million votes in 2000. (Some of those voters must have died, or not voted for other reasons.)
TIA: It’s a clinch because off simple arithmetic;
the numbers are the Clincher: The 43% statistical weighting implies
52.6 million returning Bush voters – 2.1 million more than his recorded 50.46
million in 2000. But let’s not stop there. Approximately 2.5 million died,
therefore at most 48 million could have voted in 2004. If 46 of 48 million
returned to vote in 2004, then the Final NEP overstated the number of Bush
voters by 6.6 million. No rocket science or brain surgery is required.
2008: It’s even worse this time
around. The returning Bush/Kerry voter mix was 46/37%. Even if Bush won
by the recorded 3 million votes and there was zero fraud in 2004, the mix
implies that there were 12 million more returning Bush than Kerry voters. But
if Kerry won by the unadjusted exit poll 52-47% (6 million votes) then there
was an 18 million switch!
5.2. What is wrong with the "impossible 43%" argument?
It assumes that exit poll respondents accurately report whom they voted for in the previous election. In reality, exit poll respondents seem to have overstated their support for the previous winner in every exit poll for which I could obtain data, ten in all, going back to 1976. Lots of other evidence indicates that people often report having voted for the previous winner although they didn't. Perhaps most telling is an (American) National Election Study (NES) "panel" in which people were interviewed soon after the 2000 election, and then re-interviewed in 2004.
TIA: Gore had 540,000 more official votes than Bush (actually 3 million if 5.4m uncounted votes are included). Why would returning Gore voters, but not returning Bush voters, misstate their past vote? It makes no sense.The past vote question was posed to 3,000 out of 13,000 exit poll respondents. It was not asked of 10,000 respondents. Other NEP categories did not ask about past votes (sex, race, income, party-id, location, when voted, military background, etc). The respondents were just asked whom they voted for. And 51% said it was Kerry. No fog, no forgetting.
False Recall assumes the recorded vote as a baseline, not the True Vote.
Gore won the recorded vote in 2000 by 540,000. He won the True Vote by 3 million.
There is no evidence to suggest Gore voters forgot or were motivated to lie.
Retrospective surveys matched the True Vote when total VOTES CAST were used as a baseline.
The following indicates that respondents told the truth about their past vote:
In 1968-2008, the average NES winning margin was 11.43%.
The average True Vote winning margin was 10.63%.
The average True Vote winning share deviated by 0.40% from NES.
The average Democratic True winning share deviated by 0.70%.
The average Republican True winning share deviated by 0.46%.
http://www.geocities.com/electionmodel/NESMargin_TrueRecall.gif
http://www.geocities.com/electionmodel/NESMargin.gif
2008: It’s hard to believe that the “false recall” canard is still being used, especially since Bush’s 48% approval rating in 2004 declined to 30% in 2006 and 22% in 2008. Are we expected to believe that the ridiculous 2008 Final NEP 46/37% Bush/Kerry returning voter mix is due to Kerry voters misstating their past vote to the exit pollsters? Or is it that returning Bush voters were reluctant to be interviewed? It’s a true Hobson’s choice dilemma.
5.3. What is wrong with the second argument, where new (and Nader)
voters break the stalemate in favor of Kerry?
The second argument assumes that Kerry did about as well among Bush 2000 voters as Bush did among Gore 2000 voters. Superficially, the exit poll table supports this assumption.
TIA: The 12:22am National Exit Poll indicated that Kerry had 10% of returning Bush voters and Bush just 8% of returning Gore voters. But in order to force the Final NEP to match the recorded vote, the shares had to be changed to 9% and 10%. Just changing the Bush/Gore returning voter mix to 43/37 was not sufficient to do the match. In the Democratic Underground “Game” thread, Mark agreed to the stipulation that there could not have been more returning Bush voters than were still living. In order to match the recorded vote, he had to increase Bush’s share of returning Gore voters to an implausible14.6% and at the same time reduce Kerry’s share of new voters to 52.9%. The new voter share had already been reduced from 57% at 12:22am to 54% in the Final. He had to contradict “false recall” in the “Game”, but soon reverted back to it when he saw that his vote shares were not to be taken seriously.
2008: We thought “false recall” was laid to rest in 2006, but Mark is still using it even as he concedes that Final National Exit Poll weights/shares are always adjusted to force a match to the “official” count. Contradictions abound. Mark wants to have it both ways (rBr and “false recall”). But it was a Hobson's Choice. One argument refutes the other. He is spinning like a top.
5.4. But... but... why would 14% of Gore voters vote for Bush??
If one thinks of "Gore voters" as people who strongly supported Gore and resented the Supreme Court ruling that halted the Florida recount, then the result makes no sense. For that matter, if one thinks of "Gore voters" in that way, it makes no sense that they would forget (or at any rate not report) having voted for Gore. Nevertheless, the NES panel evidence indicates that many did. (Of course, the figure may not be as high as 14% -- although it could conceivably be even higher).
TIA: Right, it makes no sense. It only makes sense if you consider that the Final NEP was forced to match a corrupt recorded vote by changing weights and vote shares obtained at the 12:22am timeline from 13047 respondents. But it’s not just the level of returning Gore defectors that didn’t make sense, neither did vote share adjustments made in the Democratic Underground "Game" to force the recorded vote match.
The Final was FORCED TO MATCH THE RECORDED VOTE.
The 43/37 returning Bush/Gore voter mix was IMPOSSIBLE.
The mix required over 6 million PHANTOM Bush voters
The Final had to adjust corresponding Bush vote shares to implausible levels.
Kerry won all plausible scenarios in a SENSITIVITY ANALYSIS of various vote share assumptions.
http://www.geocities.com/electionmodel/2004ElectionCalculator_2846_image001.png
http://www.geocities.com/electionmodel/2004s.png
http://www.geocities.com/electionmodel/TrueVoteElectionCalculator614test_15742_image001.gif
2008: To believe that 46% were returning Bush voters, there had to be 12 million more returning Bush than Kerry voters. But even assuming that the official 3 million Bush “mandate” was legitimate, one would expect a 3 million difference in turnout. Instead we are asked to believe that 4.5 million Kerry voters (7.6% of 59 million) told the exit pollsters they voted for Bush, despite his 22% approval.
TruthIsAll FAQ:
Miscellaneous
M.1. What about the reports of flipped votes on touch screens in 2004?
Many people reported difficulty voting on electronic voting machines (DREs), in particular, that attempts to vote for one candidate initially registered as votes for another. The Election Incident Reporting System (EIRS), connected to the "OUR-VOTE" telephone hotline, recorded close to 100 such incidents. TruthIsAll has asserted that 86 out of 88 reports of electronic vote-flipping favored Bush. He cites the odds of this imbalance as 1 in 79,010,724,999,066,700,000,000.
TIA: The probability calculation is correct. The odds are one in 79 sextillion. The 88 reports came from widely diverse, independent precincts thatt were just a drop in the bucket. Many people know of someone whose vote was switched right before their eyes. And yet Mark still does not accept that electronic vote switching was a major cause of the exit poll discrepancies. The votes were not just switched on touch screens. Invisible, unverifiable central tabulators “consolidate” reported precinct votes. But no one could report those vote flips to EIRS.
M.2. Did the 2006 exit polls manifest "red shift" compared
with official returns?
Yes. For instance, the initial national House tabulation -- posted a bit after 7 PM Eastern time on election night -- indicates that Democratic candidates had a net margin of about 11.3 points over Republican candidates. The actual margin was probably about 7 points, depending on how uncontested races are handled.
TIA: “Probably about 7 points”?
There is no basis for that statement. It’s a “belief” based on a few outlier
polls without allocating undecided voters. Virtually all 120 “generic”
pre-election polls gave the Democrats a much bigger margin. A time-series
regression trend line projected that the Democrats would win 56.4% of the vote.
The unadjusted aggregate state exit polls produced an identical 56.4% share.
M.3. Do pre-election "generic" House polls in 2006 match the
initial exit poll returns?
Not really. A "generic" poll is one that asks respondents whether they would vote for (in Gallup's words) "the Democratic Party's candidate or the Republican Party's candidate," rather than naming specific candidates.
TIA: That is a totally false
statement! So what if they didn’t name the candidate? That is pure nonsense!
Yes, they matched all right. The final point on the trend-line of 120
pre-election Generic Polls (which were all won by the Democrats) projected a
56.4% Democratic share. And the unadjusted exit poll aggregate was an identical
56.4%!
The Generic polls are not a good predictor of the Recorded Vote?
That is correct. But they accurately predict the TRUE VOTE!
The Generic 120 pre-election poll trend had the Democrats winning with
56.4%.
The Democrats won the unadjusted state exit poll aggregate with an
identical 56.4%.
http://www.geocities.com/electionmodel/Election2006_16921_image001.png
http://www.geocities.com/electionmodel/Election2006Final1105a_21869_image001.png
M.4. What about the massive undervotes in Sarasota County, Florida
(C.D. 13)?
Without getting into the specifics, the short answer is: I think that if voters had been able to cast their votes as they intended, the Democratic candidate Christine Jennings would have won the House race in Florida's 13th Congressional District (FL-13) by thousands of votes, instead of losing by under 400. I have seen no evidence that the events in FL-13 shed light on outcomes in any other Congressional race.
TIA: Are we to believe that FL-13 was an isolated case of missing and/or switched votes? And that there is no evidence of vote miscounting in the other 434 districts? A number of post-election studies indicate otherwise.
End of FAQ Summary Update
________________________________________________________________________________
Original FAQ
TruthIsAll FAQ: (1)
1.1. What did the national pre-election polls indicate?
According to most observers, most pre-election polls put George W. Bush slightly ahead of John Kerry. The summary of "final trial heats" at pollingreport.com shows Bush ahead in 10, Kerry ahead in 3, and one tied. (The average margin was Bush +1.45%.) Among the "pollster vote projections" (in which the pollsters may make subjective judgments about how undecided voters are likely to vote), five favor Bush, two favor Kerry, and one is a tie. (For what it is worth, both projections favoring Kerry are attributed to Democratic pollsters; one projection favoring Bush is attributed to a Republican pollster. So among nominally neutral pollsters, Bush was ahead in four projections and tied in the fifth; the average margin was Bush +1.3%.)
Please note that every single one of these polls yielded a result within its statistical margin of error, even assuming that the polls were otherwise perfect. So they certainly don't justify high confidence that Bush was "really" ahead, much less that he was destined to win. Some folks might say that the polls revealed a "statistical tie," but that characterization throws away useful information. As I said, most of the polls put Bush slightly ahead.
Yet TruthIsAll argued, in his final Election Model, that the pre-election polls gave Kerry a 99.99% probability of winning the popular vote (as well as a 99.8% probability of winning the electoral vote). Why are his numbers so different? There are two main reasons.
First, TruthIsAll uses poll results for all registered voters, rather than for likely voters, whenever possible. Presumably he believes that the pollsters were biased toward understating Kerry support. In many surveys, people who are least likely to vote tend to favor Democratic candidates. So, for instance, the final pre-election survey by the Pew Research Center gave Bush a 3-point lead among "likely voters," but gave Kerry a 1-point lead among all "registered voters." TruthIsAll uses the figure that puts Kerry ahead, even though Pew itself headlined the report, "Slight Bush Margin in Final Days of Campaign." [More on turnout and likely voters below.]
Second, TruthIsAll assumes that undecided voters will (or did) sharply favor Kerry. (His final model assumed that 75% of undecided voters would vote for Kerry -- although, in fairness, he also considered alternative proportions.) [More on undecided voters on the next page.
TIA:
Kerry and Bush were essentially tied at 48 in the final national pre-election polls, but the trend of undecided voters was to Kerry. Of the 18 national polls analyzed in the pre-Election Model, 9 were registered voter (RV) and 9 were likely voter (LV). Kerry led in 11 of the 18 polls, Bush in 6. The ABC RV poll was a tie. Kerry led the 18-poll average by 47.8-47.7% and the 9-RV poll average by 47.2-46.7%. Bush led the 9-LV poll average by 48.8-48.4%. Kerry led the 18-pre-election poll average every month except for January and September. The 0.87 statistical correlation between the 11-poll average Bush monthly approval and average poll was close to a perfect 1.0.
Final Election Day Zogby and Harris LV polls were not included in the Nov.1 election model. Both had Kerry winning by 50-47%. Including these polls, Kerry led in 13 by 48.0-47.5%. But that was before the allocation of undecided voters. Harris and Zogby said they were breaking 2-1 to 4-1 for Kerry. The 12:22am National Exit Poll (NEP) had Kerry winning the 6% of voters who decided on Election Day by 53-40% and the 10% who decided during the month prior to the election by 60-38%. So there is no doubt that Kerry won a solid majority of late undecided voters. The Nov.1 Election Model included a sensitivity analysis based on 5 undecided voter scenarios in which Kerry was projected to win 60, 67, 75, 80 and 87% of the undecided vote.
You continue to reject the historical fact that late undecided voters would break for the challenger, Kerry. But world-class pollsters Zogby and Harris, who have a combined 60 years of polling experience, indicated that their Election Day polling Kerry won undecided voters by 67-75%. The National Exit Poll also reported that Kerry won a clear majority of undecided voters. This was not unusual; historical evidence indicates that undecided voters break for the challenger over 80% of the time, especially when the incumbent is unpopular - and Bush had a 48.5% average approval rating on Election Day. Final Zogby polls in nine battleground states had Kerry leading by an average of 50-45%. He was projected to win all nine by 53-46%, but only won five by 50-49%. The margin of error was exceeded in six states - a 1 in 52 million probability.
You dismiss the significance of the Bush 48.5% approval rating on Election Day. But all presidential incumbents with approval below 50% lost re-election (Ford, Carter, Bush I) while all incumbents over 50% won (Eisenhower, Johnson, Nixon, Reagan and Clinton). The near-perfect 0.87 correlation between Bush’s monthly approval rating and national poll average share is further evidence. The correlation was confirmed by the 12:22am National Exit Poll which Kerry won by 51-48%.
You overlook the fact that 41 states switched to Bush from the final pre-election polls to the recorded vote. But none of the 10 states which switched to Kerry was a battleground state. Forty-three states red-shifted to Bush from the 12:22am exit polls. Oregon was the only battleground state which shifted to Kerry – by less than one percent. It’s also the only state in which voting is done by mail. Was this all just a coincidence, a case of bad polling or an indication that fraud occurred?
This is a graph of the 2004 National Pre-election Polls Monthly Trend
1.2. How does TIA come up with those 99+% probabilities of a Kerry
victory?
Basically, those probabilities (for both state and national polls) assume that all his assumptions (for instance, about how "undecided" voters will vote) are right, and that the only source of uncertainty is random sampling error. I argue below that his assumptions are more wrong than right. They certainly aren't 100% reliable. (TruthIsAll himself suggests that the polls might be biased -- against Kerry, of course.)
TIA:
Mark says that my assumptions are not “100% reliable” and “are more wrong than right”. What does 100% reliability mean when it comes to assumptions?
And how are they more wrong than right? Let’s take a close look at some assumptions.
-Does he mean the base case 12:22am NEP vote shares?
The sensitivity analysis provides a range of assumptions: 2000 voter turnout, Kerry’s share of returning Gore, Bush, Nader voters and others who did not
vote in 2000. Which assumptions does he believe are more wrong than right?
-Does he mean the undecided voter allocation?
I provide a 60-87% undecided voter allocation range (see the Monte Carlo EV sensitivity analysis). The 75% base case matches that of world-class pollsters Zogby and Harris. I trust their combined 70 years of experience a lot more than the Mystery Pollster. What polls did he run? Is Mark implying that MP knows more than Zogby and Harris?
-Does he mean the Margin of Error?
I use pre-election state poll 600- sample MoE (4%) to compute the MoE. The state exit poll MoE is adjusted for a user-entered cluster effect.
The 1222am National Exit Poll (13047 sample) adjusted for a 30% cluster effect yields a 1.12% MoE. In the notes Edison-Mitofsky claim the MoE is 1.0%.
-Does he mean the annual mortality rate?
I use the published U.S. 0.87% annual rate. It’s a fact.
-Does he mean the assumption that only living Gore, Bush or Nader 2000
voters could have voted in 2004?
It’s a fact. Or does he believe in reincarnation?
-Does he mean the random sampling assumption?
I refer once again to Edison-Mitofsky’s notes (link above).
-Does he mean the assertion that the Final NEP “How Voted in 2000”
weights (43% Bush / 37% Gore) and corresponding vote shares were drastically
changed to match the Bush 51-48% vote?
It’s a fact. The Final NEP has always been matched the recorded vote.
-Does he disagree that the “How Voted in 2000” weights were
mathematically impossible?
It’s a fact. Do the math.
-Does he disagree that matching to the NEP only makes sense if the
election is fraud-free?
Is it his assumption that 2004 was fraud-free? What about 2000, 2002 and 2006?
-Does he disagree with the overwhelming statistical evidence that the
election was stolen?
In light of the above, is that not a fair conclusion?
No, high turnout is not a reason to dismiss the likely-voter results. Most pollsters already expected high turnout. For technical reasons, it is hard to compare pollsters' various turnout assumptions to the official figures, but the survey results don't change very sharply if we change turnout assumptions by a few points. To include every respondent who claims to be registered would include many people who have very little prospect of voting.
In Pew's final pre-election poll (data available for download here), Pew scored over 62% of its respondents as "likely voters," scoring 8 or 9 on its 0-to-9 likely voter scale. (Actually, this percentage is weighted -- for instance, young respondents weigh morre heavily than older ones. The unweighted results are even less favorable to Kerry.) The actual presidential turnout in 2004 is estimated by Dr. Michael McDonald at about 60.3% of the eligible voting-age population. In order for Kerry to take a slight lead in the Pew survey, one must either include all voters scoring as low as 5 on the likely voter scale -- which implies about 77% voting-age turnout -- or assume that about three quarters of all undecided voters would vote for Kerry. In order to give Kerry an appreciable lead, one has to jack up the projected turnout and allocate the vast majority of undecided voters to Kerry.
By strange coincidence, TruthIsAll did exactly that: he jacked up the turnout to include all self-reported registered voters (which, in the Pew survey, would be about 80% voting-age turnout, or around 160 million voters nationwide instead of 120 million), and allocated three quarters of undecided voters to Kerry. Presto, Kerry took the lead.
In January 2005, TIA claimed, "Any reputable pollster will tell you that in this election, RV's were a more accurate gauge of the vote." What a strange claim. Pollingreport.com reports (here and on the following "earlier" pages) likely-voter results from well over a dozen separate pollsters. Were they all disreputable? Did they all repudiate their likely-voter models?
TIA:
It’s nonsense to extrapolate voter turnout based on the type of poll. Pollingreport.com also provides companion RV polls from these same pollsters. Nine of the final 18 national polls in my pre-election model were RVs – and presto! Kerry won 5. Nine were LV’s – and presto! Kerry won 6! You could look it up.
________________________________________________________________
1.4. How about the state polls?
There TIA's data hold up somewhat better, although his probabilities don't. While the national polls (prior to TIA's massaging) fit the official results rather closely, the state polls do not fit as well. The median state poll in TIA's analysis, prior to TIA's allocation of undecideds, had a Kerry margin about 2.8 points larger than Kerry's actual performance. After allocating undecideds 75% to Kerry, the median discrepancy is about 4.5 points.Looking at the crucial battleground states, the discrepancies don't seem very suspicious.
TruthIsAll had Kerry ahead by three points in Ohio, but only one Ohio poll out of the last ten actually put Kerry ahead. (This discrepancy could owe to flukes of timing, TIA's preference for registered-voter results, and/or TIA's reported propensity to ignore certain survey results he regards as biased.) Thus, although TIA's final model (again, the link -- find "OH") gave Kerry an 86.49%% probability of winning Ohio, most observers would have leaned in the other direction. In my roundup, combining RealClearPolitics.com and electoral-vote.com figures, Bush had an average 1.9-point lead in the Ohio polls, quite close to his official margin of 2.1 points. (By the way, I checked two sources to ensure that RealClearPolitics' evident political bias didn't seep into its poll reporting; the results are closely comparable. Below, I link to RCP because its tables are easier to read.)
Similarly, because of TIA's allocation of most undecideds to Kerry, his Interactive Election Simulation spreadsheet gave Kerry a 73% chance of winning Florida despite depicting the race as nominally tied in the polls. In his final model report, Kerry has over an 86% probability of winning Florida. (The RealClearPolitics.com roundup gives Bush a narrow average margin of 0.6 points, with Bush ahead in 4 polls, Kerry ahead in 3, and the other 2 tied.) Bush did clearly do better in Florida than polls had projected, winning by just over 5 points.
Kerry won Pennsylvania as projected -- although even there, TIA's 96.69% probabiility in the final model seems misplaced. Kerry's 2.3-point winning margin in Pennsylvania was smaller than TIA's estimated 5 points prior to allocating undecideds. However, in the RealClearPolitics.com roundup, no poll put Kerry more than 4 points ahead; the average was 0.9 points, and the median was 2 points.
In summary, first of all, TruthIsAll's simulation results asserting a 99.8% probability that Kerry would win the electoral vote depended heavily on very favorable assumptions about Ohio and Florida. Second, the state polls may have overstated Kerry's official vote share, although part of the overstatement probably owes to TIA's selection of polls. (Later I will consider the argument that the state-level pre-election poll discrepancies and the exit poll discrepancies support each other as evidence of fraud.)
TIA:
You fail to distinguish between weighted and unweighted averages, claiming Bush led the pre-election state polls. But you used an unweighted average to derive the national share. Kerry led the national weighted average (based on state voting population) from July to Election Day, except for a brief period in September. Kerry also led in the national pre-election polls all year.
You use the median of the data set when you should be using the weighted mean. Despite your protestations to the contrary, the pre-election polls did NOT match the official recorded vote, but DID match the exit polls. Kerry led the 18 nationals by a slight 0.5% - before my so-called undecided allocation “massaging”. Allocating undecided voters is necessary for projecting the final vote. Even professional pollsters do it. It’s foolish to ignore undecided voters, especially when a very unpopular president with a 48% approval rating is running. I believe Zogby and Harris.
Go here to see how the individual pre-election state and exit polls compared to each other - and to the recorded vote.
On the other hand, matching the Final NEP to a miscounted recorded vote is not massaging; at best, it’s inadvertent poll-rigging and intellectually dishonest. It implies ZERO fraud. There is no justification for matching the Final Exit Poll to the recorded vote. It’s just catapulting the propaganda for an illegitimate regime. The use of bogus, mathematically impossible weights and implausible vote shares in order to match the Final National Exit Poll to a fraudulent vote count is, well…fraudulent.
The Interactive Election Simulation graph displays the results of a 200- election trial run. In PA, Kerry’s RECORDED exit poll margin understated his TRUE margin by 5%. As for Ohio, you apparently still believe that Bush won the state. Kerry won the OH exit poll by 52-48%. And you claim that Bush clearly did better in Florida (he “won” by 5 points). Once again, you fall into the insidious trap of implicitly assuming that the RECORDED vote was fraud-free.
TIA and others have argued that the pre-election polls were biased against Kerry because they do not cover people who only use cell phones -- and these were disproportionately young voters who favored Kerry. Scott Keeter, drawing on a close analysis of Pew Research Center survey data, has concluded that because the polls are weighted to match the age distribution in the population, cell-phone-only voters had little effect on the polls' accuracy. "While cell-only voters were more supportive of John Kerry than voters overall, they were similar to voters within their own age cohort."
(Keeter's findings also appeared in Public Opinion Quarterly.) Certainly Pew's age weightings seem fairly close to the mark. For instance, in their final pre-election poll (weighted), respondents aged 18-24 comprise 8.5% of the likely voters, and respondents 18-34 total 22.9%.
In the Current Population Survey, self-reported voters 18-24 are 9.3% of all voters, and voters 18-34 are approximately 23.8% (derived from Table B). If one assumes, generously, that voters 18-24 favored Kerry about 60% to 40%, then any underrepresentation of young voters may have cost Kerry a small fraction of a percentage point in Pew's likely voter estimate.
TIA:
In 2004, 122.3 million votes were recorded. According to voting records cited by Greg Palast, over 3 million additional votes were uncounted (spoiled, provisional, absentees, etc), confirming the 2004 Census Vote Survey (0.30% MoE) which indicated that 125.7mm voted. Approximately 27 million (22% of 125.7mm) were voters who did not vote (DNV) in 2000.
According to the 7:33pm National Exit Poll, about 61% of DNV (16.5mm) were NEW voters (mostly younger cell-phone users). Kerry won the DNV group by 59-39% (5.4mm votes). According to the 12:22am NEP (13047 respondents) Kerry won DNV by 57-41% (4.4m votes).Assuming that Kerry’s share of NEW voters was equal to his total DNV vote share, then his vote margin was approximately 3.0m among these NEW voters. Since Kerry lost the RECORDED vote by 3 million, the number of NEW voters was a significant component of the TRUE Kerry vote.
________________________________________________________________
The
"Rules": Did They Favor Kerry?
2.1. Don't undecided voters break sharply for the challenger?
Undecided voters probably sometimes break sharply for the challenger. But I can find no evidence that this rule is useful in "allocating" reported undecided voters in presidential elections. In fact, overall, reported undecideds seem to break about evenly.
In support of the claim that undecideds break for the challenger, TruthIsAll has cited an essay by Chris Bowers at MyDD. Bowers canvassed 28 presidential polls going back to 1976, and concluded that "undecideds break overwhelmingly -- better than 6 to 1 -- in favor of the challenger in a Presidential race." But a close reading reveals that Bowers did not examine declared "undecided" voters at all!
Bowers basically found that on average, incumbents did about 0.3 points better than the final polls indicated, while challengers did about two points better – indeed a ratio of more than 6 to 1. This result mostly had nothing to do with undecided voters. Nine of the 28 surveys were from 1996, a year in which the pre-election polls overstated incumbent Bill Clinton's winning margin by over 4 points on average. Five of those surveys reported no undecided voters whatsoever -- and their errors were not systematically different from the other four surveys'. (The second most accurate survey that year reported 11% undecided, equalling the other eight surveys combined.) Clearly Bowers's analysis cannot be used as a guide to allocate reported undecided voters. At most it might imply that challengers tend to do well when some polls report a lot of undecideds, but I see little support for even this inference.
I examined a total of 31 presidential polls going back to 1972, using the same National Council on Public Polls dataset used by Bowers. (1972 was the earliest year with multiple polls, at least one of which reported undecided voters.) In some elections, the polls with higher reported undecided rates indicated less net support for the incumbent than the other polls; in others, they indicated greater incumbent support. Overall, the results indicate no statistically significant relationship between percentage undecided and incumbent support. Thus, there is no statistical support for altering the margin to account for reported undecideds. Another way to say that is that reported undecideds seem to break about evenly (since allocating them doesn't appreciably alter the margin), perhaps slightly toward the challenger on average. But every election and every poll is different, so it is probably best just to say that we don't know.
TIA:
You neglect to mention that in our previous discussions (on DU and elsewhere), I cited a 155- election survey in which challengers won the undecided vote in 127 and incumbents won the undecided vote in just 19.
http://www.pollingreport.com/incumbent.htm
This is what the Gallup poll said about undecided voters:
“In the final USA TODAY/CNN/GALLUP poll before
the election, President Bush held a 49-47 edge over Sen. John Kerry when the
undecided voters were not allocated to a particular candidate. When Gallup, using a statistical model that
assumes that 9 of 10 of those voters would support Kerry, allocated the
voters, the poll ended as a dead heat with each candidate garnering 49%. The Gallup allocation formula is based on
analyses of previous presidential races involving an incumbent”.
You also fail to mention that I have referred to world-class pollsters Zogby and Harris. They have stated that challengers typically win over 2/3 of the undecided vote. The reason is straightforward. Voters are undecided when they are not enthusiastic about the incumbent. Bush had a 48.5% average rating in Election Day. A clear majority were NOT satisfied with his performance - especially undecided voters.
Assuming that Kerry got 2/3 of the late undecided votes, he was poised to be 51.5-47.5% winner. My pre-election model forecast a 51.3 - 47.7% Kerry win based on final state pre-election polls and 51.1 - 47.9% based on the final 18 national pre-election polls. The exit polls indicate that Kerry won a solid majority of the late undecided voters (last three days), as well as those who decided in the last month (60-38%).
This is what Zogby had to say about undecided
voters and Bush approval ratings a few days before the election:
So, first of all, the numbers. We have been looking for months at what we call a virtual tie between Kerry and Bush. I can report to you this morning that it's an actual tie. It's 47 percent for Kerry and 47 percent for Bush. You will note that my hair is a little grayer these days than it has been, where we stand today, we have approximately 5 percent undecided. We go as low as 4 percent undecided on some days.
Who are these undecided voters? They do tend to be Independents, that is, in terms of party affiliation. They do tend to be moderates, meaning not liberal and not conservative. Unlike previous years, they tend to be middle-aged voters, meaning not young and not old. We have polled them – the undecideds, that is. We have also done focus groups among undecideds. Contrary to popular belief, contrary to what I, personally, believed; these undecideds generally have told us that they had their minds made up in the past. This is a new phenomenon for them. They also told us that they were paying attention. They could identify for us basically where each candidate stood on the issues. Since we did the focus groups in the so called "battleground states" of Michigan, Ohio, Pennsylvania, Florida and Minnesota, they told us that they have seen campaign commercials.
Here are some of the things that we have found out among undecided voters: They like the President as a person. They give the President good marks for leadership and decisiveness. They appear to be very much opposed to the war and to the way that we got into the war. They give the President good marks on personal morality and family values. At the same time, they tell us that they like John Kerry, that he is smart enough, they believe that he is competent enough to be President. They also feel that John Kerry is one that they identify with on their issues, which are domestic issues that we heard about, the economy and health care, education and so on. They have questions about whether or not they trust Kerry, about whether or not they believe where he stands on issues. They do tend to say, and I guess after hearing so many commercials and seeing so many commercials, that they feel that Kerry is a person who changes his position to win popular support.
The undecideds told us that they're passionate, that they will vote. Some of them indicated that they were actually agonizing over their choice. And they also told us that they're genuinely undecided. Significantly, from the polling, and not from the focus groups, we find that only 1 in 5 of the undecided voters tell us that the President of the United States deserves to be reelected. Between one-third and 40 percent, so between 30 and 40 percent of the undecideds tell us that they feel it is time for someone new, and then half of the undecideds are not sure, or they're undecided, about that question, the President.
Now, on the basis of history, if history is any guide whatsoever, I still believe: number one, that the race is about the incumbent, a referendum on the incumbent, and the fact that the incumbent has not broken 48 percent suggests to me that the President is not polling good numbers for reelection. In addition to that, in terms of the other barometric readings that I look at, you still have a net negative of voters who say that the President is not doing a good job. He gets a negative job performance rating. He gets a negative reelect, meaning slightly more people think it's time for someone new than that he deserves to be reelected. And slightly more people feel that the country is headed on the wrong direction. Now, the President has improved all of those numbers, but they're still not reelection numbers. In addition to that, on the top five issues that the voters tell us are tops on their minds, the President leads in one of those issues, fighting the war on terrorism: He leads substantially against Senator Kerry. Among the other four issues, Senator Kerry leads by double digits over the President.
The key reason why I still think that Kerry will win, perhaps, possibly (laughter) -- have I made myself clear here? Okay. That traditionally, the undecideds break for the challenger against the incumbent on the basis of the fact, simply, that the voters already know the incumbent, and it's a referendum on the incumbent. And if the incumbent is polling, generally, under 50 percent and leading by less than 10, historically, incumbents have lost 7 out of 10 times. In this instance you have a tie, a President who is not going over 48, undecideds who tell us by small percentages that the President deserves to be reelected. And in essence, it gives all the appearances that the undecideds -- the most important people in the world today -- have made up their minds about President Bush. The only question left is: Can they vote for John Kerry? If it's a good turnout, look for a Kerry victory. If it's a lower turnout, it means that the President has succeeded in raising questions about John Kerry's fitness”.
---------------------------------------------------------------------------------------------------------------------------
This is what Harris Interactive said about
undecided voters:
Final Pre-election Harris Polls: Still Too Close to Call but Kerry
Makes Modest Gains
“The final Harris Polls show Senator John Kerry making modest gains at the very end of the campaign in an election that is still too close to call using telephone methods of polling. At the same time, the final Harris Internet-based poll suggests that Kerry will win the White House today in a narrow victory. Harris Interactive’s final online survey of 5,508 likely voters shows a three-point lead for Senator Kerry. The final Harris Interactive telephone survey of 1,509 likely voters shows a one-point lead for President Bush. Both surveys are based on interviews conducted between October 29, 2004 and November 1, 2004. The telephone survey is consistent with most of the other telephone polls, which show the race virtually tied.
If this trend is real, then Kerry may actually do better than these numbers suggest. In the past, presidential challengers tend to do better against an incumbent President among the undecided voters during the last three days of the election, and that appears to be the case here. The reason: undecided voters are more often voters who dislike the President but do not know the challenger well enough to make a decision. When they decide, they frequently split 2:1 to 4:1 for the challenger.
About one percentage point of the current difference probably reflects the inclusion in the online sample of people with cell phones but no landline (and therefore not included in the telephone survey) who favor Kerry by a wide margin”.
---------------------------------------------------------------------------------------------------------------------------
This is what Frank Newport, Editor in Chief of the Gallup Poll, said about undecided
voters and Bush approval:
Is the presidential race still too close to call?
Yes. No matter how you look at the
data, the two major-party candidates are neck and neck. Gallup's final Oct.
29-31 CNN/USA Today/Gallup poll shows that if all registered voters actually
turn out (which is not likely to happen, of course), John Kerry wins over
George W. Bush by two points.
Among likely voters, including our estimate of what the remaining undecided voters will do on Election Day, the race is dead even at 49% for each candidate.
Analyzing the data in other ways, such as modifying likely voter assumptions and changing turnout estimates, doesn't make a substantial difference in the election predictions. The support for both candidates is basically in the upper-40% range, and the final popular vote may well depend on which side is best able to mobilize its voters to go to the polls.
How does Gallup decide how to "allocate" undecided voters?
The allocation procedure is a
Gallup tradition, and represents Gallup scientists' best estimate of what the
final popular vote will be on Election Day.Here's how it works. The unallocated
numbers in the pool of likely voters (that is, the percentages of likely voters
supporting Bush and Kerry, not including undecided voters) are 49% for Bush and
47% for Kerry. We assume, based on an analysis of previous presidential and
other elections, that there is a high probability that the challenger (in an
incumbent race) will receive a higher percentage of the popular vote than he
did in the last pre-election poll, while there is a high probability that the
incumbent will maintain his share of the vote without any increase.
This has been dubbed the "challenger rule."
There are various explanations for why this may occur, including the theory that any voter who maintains that he or she is undecided about voting for a well-known incumbent this late in the game is probably leaning toward voting for the challenger.This persistent historical pattern is the basis for Gallup's decision to allocate the 3% undecided vote to Kerry and Nader/other, making the final estimate 49% Bush, 49% Kerry and 2% Nader/other.
How might the president's job approval rating influence the outcome of the election?
A president's job approval rating is an important indicator of re-election probabilities. But like so much else in this election, this measure isn't giving us a great deal of direction right now. Bush's job approval has slipped to 48% among national adults and is thus below the symbolically important 50% point. If we take that 50% line seriously, then Bush is in a less-than-auspicious position. No president since Harry Truman has won re-election with a job approval rating below 50%.
But the last two presidents who lost (George H. W. Bush and Jimmy Carter) had job approval ratings much worse than George W. Bush's 48%. He is clearly not as bad off as they were. On the other hand, the winners all had job approval ratings well above 50%. Bush is in a gray zone when it comes to his job approval rating.
What is the impact of turnout among younger voters?
We've heard a lot about the impact of younger voters this year. The data indeed show that Kerry does better among younger voters -- that is, those under age 30. Among all national adults in that age group, Kerry wins by a 59% to 34% margin.
_______________________________________________________________
On average, it is true that incumbents don't do better -- or, rather, much better -- than their predicted shares in the final polls. As noted above, in the polls examined by Bowers (and by me), on average, incumbents did about 0.3 points better than the final polls indicated.
Averages can be misleading, and this one is. Remember the old joke about the hapless target shooter who grazes a tree with one shot, kills a bystander with the next, but brags that on average he nailed the bullseye? Well, in two of the five elections in the Bowers analysis (the five being 1996, 1992, 1984, 1980,
and 1976), the incumbent improved his vote share by about 2 points over the polls. In 1984, Ronald Reagan averaged 57% over six polls and got 58.8% in the official returns. In 1976, Gerald Ford averaged 45.7% over three polls (although that average is influenced by one poll that is much lower than the others) and got 48.0% in the official returns.
These elections are partly offset by 1996, not only because Clinton actually earned a lower vote share than predicted in the polls (50.3% in the polls, 49.2% in the vote), but because there were more polls in that year. So, on average, the incumbent poll figures are close to the official percentages. George W. Bush's 2004 share across the 14 trial heats in the pollingreport.com roundup was about 48.5%; his official vote share was 50.7%. Thus, an improvement of about two points, as in 1976 and 1984 -- hardly a wild exception to a well-established rule.
TIA:
I refer you to the preceding Zogby and Harris statements. Apparently, you disregard their combined 70 years of polling experience. You resort to citing a 2% deviation from the vote in 2 of the five elections. Reagan won a landslide. To say that he did 2% better in the poll average than the vote is reaching. As for Ford, you cite a limited 3-poll average. Since one of the three polls was much lower than the average, Ford’s vote share had to be lower than his other poll numbers indicated. Why not provide the actual poll results?
Once again, you assume that Bush’s true vote was 50.7%, and that there was no fraud. That is not a good assumption to make. This is analogous to the Final Exit Poll matching to an assumed fraud-free recorded vote count. My exit poll analysis indicates that the true Bush vote was 47%. The pre-election projection model had Kerry leading the final 18 national poll average by 48-47%.
2.3. What about the rule that incumbents don't win when their final
approval rating is below 50%?
TIA has stated that Bush's approval rating on November 1 was 48.5% based on the "average of 11 polls." I'm not sure which polls are included in that figure; different surveys typically yield slightly higher or lower approval figures. During October 2004, the Gallup Poll reported six approval figures for Bush: two above 50%, three below 50%, and one exactly 50%. The last pre-election survey put him at 48% approval, 47% disapproval, and 5% "not sure." Gallup's two November polls gave Bush 52% and 55% approval.) So, Bush's final Gallup approval rating was below 50%, although not very far below. So, is a final Gallup approval rating (slightly) below 50% a sure sign of imminent defeat? Starting in 1972, TIA cites three incumbents with approval ratings below 50, and two with approval ratings in the 50s. In order of approval rating, they are:
|
Year |
Incumbent |
Approval |
Vote |
|
1992 |
Bush (I) |
30 |
46.5% |
|
1980 |
Carter |
31 |
45.4% |
|
1976 |
Ford |
46 |
48.9% |
|
1996 |
Clinton |
55 |
54.7% |
|
1972 |
Nixon |
59 |
61.8% |
(By the way, TIA's 1992 figure appears to be from late September. A Gallup/Newsweek poll in late October gave Bush a 37% approval rating, which does not much alter the analysis. I do not know why TIA excluded 1984; a Gallup poll in late October showed Reagan at 58% approval, and he won 59.2% of the vote.)
Notice that prior to 2004, there is no incumbent with an approval rating between 46 and 55. So, one might say it is a rule that "incumbents with approval ratings under 50 never win." But one might just as accurately say that "incumbents with approval ratings over 46 always win." Does one of these statements make more sense than the other? For what it is worth, let's examine a plot of final approval ratings vis-a-vis incumbent two-party vote shares from 1956 on.
http://www.geocities.com/electionmodel/TruthIsAllFAQResponse_image001
In the plot above, the dashed blue line is the best-fit line for all these elections. The solid purple line is the best-fit line excluding the 1956 and 1964 elections, which appear to be out of trend. (The 1956 and 1964 approval ratings are from summer polls -- as are the 1972 and 1976 ratings.) Either way, it appears that incumbents with approval ratings over 45 are likely to win! The thinner, vertical purple line depicts this break-even point. (Notice that Carter in 1980 and Bush in 1992 each won over 45% of the two-party vote despite approval ratings in the low 30s.) Note also that 2004 lies below the best-fit lines: if anything, Bush might have been expected to do slightly better in the election based on his approval rating. With so few data points, it would be fairest to say that the election could have gone either way.
TIA:
Carter and Bush both LOST and had approval ratings below 50%. You can have your own theories, but not your own facts. And the FACT is that ALL incumbents with final approval ratings under 50% LOST the election – and that includes Bush. Your attempt to twist this FACT is patently obvious. Your scatter plot is just a diversion. Why don’t you just accept this FACT and move on?
The 0.87 correlation between the Bush 11-poll average 2004 monthly approval rating and his monthly pre-election 18-poll average was close to a perfect 1.0, indicating a very strong relationship. His Election Day approval rating was 48.5%. Kerry won the 12:22am National Exit Poll by 51-48%.
_______________________________________________________________
TruthIsAll FAQ: (3)
Describing
the Exit Poll Discrepancies
3.1. How do the exit polls work?
That's a long story. Let me say first of all that the main point of the exit polls is not to project who will win the election -- although the exit poll interviews are combined with vote count data in order to make projections. Mostly, the exit polls are used to provide information about who voted for whom and why. This purpose explains why the exit poll questionnaires are so long -- containing up to 30 questions.
In 2004, the exit pollsters chose anywhere from 15 to 55 precincts in each state for their exit poll sample: a total of 1480 precincts nationwide. Interviewers are sent to the corresponding polling places, some of which host more than one precinct. At some polling places, interviewers were instructed to approach every voter; at most, interviewers were instructed to approach every "Xth" voter, where X could be anywhere from 2 to 10. This instruction is intended to provide a random sample within the precinct; the value of X is chosen to obtain about 100 completed questionnaires per polling place.
The interviewers ask each approached voter to complete the exit poll questionnaire (attached to a clipboard). Slightly over half of the approached voters agreed to complete the questionnaire. Three times during the day, the interviewers call in tallied results for reported votes (presidential and often statewide races), plus all the answers on a subsample of questionnaires. In some states with many early/absentee voters, the exit pollsters also conduct telephone surveys of these early voters. (In vote-by-mail Oregon, only a telephone survey is conducted.)
Back at 'exit poll central,' the exit pollsters use these data in two ways: to make projections and tabulations. Projections are estimates of the vote shares in each state (and DC), together with measures of the uncertainty in those estimates. These projections initially are based on the interview tallies, which are compared with past results from the same precincts. Sometimes the interview tallies alone suffice to "call" the winner of a state with great confidence, especially if the race was not expected to be very close to begin with. Often the interview tallies are inconclusive. In these more competitive states, the exit pollsters continually update their projections to incorporate actual vote counts. The analysts examine both "quick counts" from the exit poll precincts and selected other precincts, and cumulative county-level totals. As quick counts become available, they replace the interview data in the projections.
Tabulations "break down" the vote share by various categories: for instance, gender, family income, or religious affiliation. These tabulations are computed for each state and for a special national sample. Preliminary tabulations were released for each state as the polls closed, and later updated to match the updated projections -- in effect, to match the official returns. (Actually, the initial tabulations were weighted to match the composite projections, which incorporate not only interview data but pre-election expectations.) National tabulations were updated several times, incorporating interview data and official returns from various states as they became available. Such tabulations, as posted on CNN.com, became the basis for much of the exit poll controversy.
3.2. How accurate are exit polls?
It depends, of course. Most attempts to argue that exit polls are highly accurate strangely steer around U.S. national exit polls; Steve Freeman, for instance, in his well-known 2004 paper, focuses on Germany and Utah. There is no single measure of exit poll accuracy, and even if there were, we wouldn't know what it equaled for all past U.S. exit polls. If you look closely, many of the arguments boil down to assertions that the exit polls should be accurate.
One useful accuracy measure is the "Within Precinct Error" (WPE), which basically equals the percentage difference between the exit poll margin and the official margin for each precinct. By convention, WPE is positive if the Republican candidate does better in the exit poll than in the official count, and negative if the Democratic candidate does better in the exit poll. (For instance, if Kerry led in a precinct exit poll by 5 points, but trailed in the official count by 3 points, the WPE would be -8 points.)
We know that in the last five large-scale presidential exit polls*, the average WPE has always been substantially negative, overstating the Democratic performance: -2.2 points in 1988, -5.0 points in 1992, -2.2 points in 1996, -1.8 points in 2000, and -6.5 points in 2004. (See page 34 of the evaluation report.) So, as far as we can tell from WPE, no recent exit poll has been accurate within the margin of error. And the 1992 survey was almost as far off as the 2004 survey. As Mark Blumenthal has pointed out, the documentary The War Room confirms that the actual 1992 exit poll projections -- at least at midday -- overstated Bill Clinton's performance. Few people noticed at the time: partly because the exit polls were not leaked on the Internet, partly because the discrepancies only altered the magnitude of Clinton's victory.
* Fine print: (1) I said "large-scale" because the Los Angeles Times has conducted national presidential exit polls, but those are much smaller. (2) In 1988, each network conducted its own exit polls; the WPE figure here is for CBS, the exit poll on which Warren Mitofsky worked. Later exit polls have been conducted by a series of network-sponsored consortiums.
Another useful accuracy measure is the Call 3 (end-of-day) "Best Geo Error" for each state. The Best Geo error is the discrepancy between the vote share estimate, based on interview data, and the official returns. (Like WPE, the Best Geo error is reported as a percentage difference in margins.) The vote share estimates can vary substantially from the raw percentages used to calculate WPE; they incorporate information on turnout, estimates of early and absentee voting (often based on telephone polls), and comparisons with past races. The average state Best Geo Error in 2004 was -5.0 points, somewhat smaller than the mean WPE.
TIA:
The exit polls always do not overstate the Democratic share; the vote count does. Remember, approximately 3% of total votes cast are never counted. Since about 80% (2.4%) are democratic, the exit poll margin differential due to this factor alone is 1.8%.
3.3. Couldn't spoiled ballots and/or fraud account for these past
discrepancies?
Probably not, although they certainly may contribute. Greg Palast offers an estimate of 3.6 million (or "3,600,380 to be exact") uncounted ballots in 2004 alone. In Palast's account, these include about 1.4 million spoiled ballots (ballots for which no presidential vote was counted, such as the infamous "hanging chad" ballots in Florida) -- also known as "residual votes" or "overvotes and undervotes." They also include about 1.1 million uncounted provisional ballots and over half a million absentee ballots. These figures do not add up to 3.6 million, and it isn't clear where they come from, how accurate they are, or what proportion of these ballots were cast for Kerry. (Electionline.org reported approximately 528,000 uncounted provisional ballots nationwide, although these figures were known to be incomplete.) We can at least say that many ballots go uncounted in each election, and there is good reason to believe that these uncounted ballots are disproportionately Democratic. (It is very hard to say how disproportionately Democratic they are.)
Whatever advantage uncounted ballots have conferred to Republican candidates in the past, they are unlikely to account for much of the exit poll discrepancies. There is no obvious relationship between uncounted ballots and exit poll results. For instance, New Hampshire has had double-digit exit poll discrepancies (Within Precinct Error) in three of the last four presidential elections (evaluation report, page 33), but its residual vote rate was 1.7% in 2000 and 1.2% in 2004. (Incidentally, 2000 was the election without a double-digit WPE in New Hampshire.)
One might suppose that uncounted ballots could at least account for a mean WPE of about -2, arguing like this: if 3% of votes are never counted, and if these uncounted votes skew 80:20 to Democrats (2.4% of total vote to 0.6%), then they cost Democrats about 1.8% on the margin. However, the arithmetic is less favorable to this analysis than one might suppose, because Democratic votes lost in heavily Democratic (or heavily Republican) precincts have minimal impact on expected WPE in those precincts. For instance, if a precinct's voters actually cast 90% of their votes for the Democratic candidate, but fully 5% of those Democratic votes go uncounted, the Democrat will end up with about 89.5% of the vote, for an expected WPE of -1 in that precinct.
One certainly can't rule out a priori that fraud might account for at least part of the 1992 exit poll discrepancies. But as far as I know, no one has made a serious attempt to argue that George H. W. Bush committed double-digit fraud in New Jersey that year (as the exit polls might be taken to suggest) – or, more generally, to explain how Bush stole perhaps 5 million net votes that year, and why he bothered. In the end, the argument seems circular at best. People who began by asserting that exit polls are accurate end up asserting that the 1992 exit polls possibly may have been accurate.
TIA:
You gloss over uncounted votes as
having minimal impact on WPE in heavily Democratic precincts. This assertion
makes no sense. Votes are accumulated
at the state level. The WPE in a particular precinct is irrelevant to the final accumulated state total. Compare the 2004 recorded vote (122.3m) to total votes cast (125.7m). That’s a 3.4 million vote difference. If we assume that 80% of the 3.4 million or 2.7 million were Kerry votes and the other 20% (0.70 million) were Bush votes, that’s a net loss of 2 million votes to Kerry. Since Bush “won” the recorded vote by 62-59mm, a full 2/3 of the 3 million vote margin was due to uncounted votes. Let’s do the numbers: Add Kerry‘s 2.7m UNCOUNTED votes to his RECORDED 59m to get his total of 61.7 million. Do the same for Bush: 62+0.7= 62.7m. There goes the Bush “mandate” – from 3 to 1 million. And we haven’t even yet considered the votes which were SWITCHED electronically from Kerry to Bush.
________________________________________________________________
3.4. What about exit pollster Warren Mitofsky's reputation for
accuracy?
Here is how Mitofsky International's website puts it: "[Mitofsky's] record for accuracy is well known. 'This caution in projecting winners is a Mitofsky trademark, one which has served him well...,' said David W. Moore, the managing editor of the Gallup Poll in his book, The Super Pollsters." http://mitofskyinternational.com/company.htm). In other words, Mitofsky very rarely "called" or predicted the winner incorrectly. (Mitofsky died on September 1, 2006; as of this writing, the page I have cited is still active.)
If Mitofsky's calls were rarely wrong, doesn't this mean that the exit poll data must be highly accurate? No, it doesn't. One reason for Mitofsky's success was that he avoided making calls in close races based on interview data alone. Edison/Mitofsky (the firms that jointly conducted the 2004 exit poll) did not make any incorrect projections in 2004. Perhaps people who believe that the exit polls evince fraud should take Mitofsky's "caution in projecting winners" more seriously.
TIA:
“Mitofsky’s record for accuracy was well-known”. Does this quote refer to the preliminary or the Final exit polls? The Final is always matched to the vote
count. We know that 3% of total votes cast in every election are uncounted and heavily Democratic. So from the get-go, matching to the Final vote is incorrect. And what about votes which are switched? So to argue that Mitofsky is accurate is a double-edged sword. Final exit polls are matched to a fraudulent recorded vote count while preliminary polls are closer to the True vote. But few are aware of the preliminary exit poll timeline, whereas the finals are shown on media sites and in the newspapers.
3.5. Didn't the exit polls indicate that Kerry won by more than the
polls' margin of error?
It depends on what one means by "the exit polls" and "won." As I explained above, there are really 51 different exit polls (if one counts the telephone-only poll in Oregon), one for each state plus D.C. For each state exit poll, we now know the final projection based on interview data alone (called the Call 3 Best Geo), as well as the pollsters' estimate of the uncertainty in each projection. (See the table on pages 21-22 of the exit poll evaluation report.)
The final interview-only projection for Ohio showed Kerry ahead by 6.5 points with a "standard error" of 3.9 points. Using the conventional 95% standard for
"margin of error," the margin of error would be 7.8 points. Using the 99.5% standard that the exit pollsters used as the first (not only) criterion for a "call status," the margin of error was over 10 points. So, Kerry's apparent lead in Ohio was within the margin of error. Kerry led in three other interview-only projections in states that Bush eventually won; all three were also within the margin of error. The election was too close to call based on exit poll data alone.
However, the national sample had about 12,000 respondents, and it gave John Kerry about a three-point margin. If the national exit poll were a random sample, its 95% margin of error on the margin would be about 1.8% -- so Kerry's lead appears to be outside the margin of error. The pollsters did not calculate an uncertainty estimate for the national sample, because they do not figure projections for the popular vote. If they did, probably even Kerry's lead in the national sample would be within the margin of error, at least using the 99.5% standard. (Note that the concept of "margin of error" is widely misunderstood: see point 3.9 below.)
TIA:
You say: “However, the national sample had about 12,000 respondents, and it gave John Kerry about a three-point margin. If the national exit poll were a random sample, its 95% margin of error on the margin would be about 1.8% -- so Kerry's lead appears to be outside the margin of error.” Not true. The NEP had 13047 respondents. The MoE is 0.86% assuming a zero cluster effect. For a 30% cluster effect, it’s 1.12%.
Pollsters always use a 95% confidence level to calculate the MoE (1.96 standard deviations from the mean).
If p = the Bush state poll vote share; 1-p = Kerry’s poll share; n= sample size.
MoE = 1.96 * sqrt (p* (1-p) / n) is the standard deviation.
The probability that the Bush state vote (v) would exceed his exit poll share (p) is given by the Excel function:
Probability = NORMDIST (p, v, MoE/1.96, true).
The probability that the Bush vote discrepancy would exceed the MoE in any given state is .025 (1 in 40)
The Bush vote/poll discrepancy exceeded the MoE in 16 states.
The probability that the MoE would be exceeded in 16 or more states by Bush is given by the Excel function:
Probability = 1- BINOMDIST (15, 50, .025, true).
The probability is 1 in 19 trillion!
3.6. Why are the pollsters' estimates of uncertainty larger than the
ones calculated by TruthIsAll and others?
TruthIsAll sometimes has argued that the exit polls should be treated as simple random samples (like drawing marbles from a hat). In this instance, the margin of error for Ohio, with a reported sample size of 2040, would be about 4.5 points on the margin using the 95% standard. There are two problems with this reasoning. First, the exit polls are not simple random samples; they are limited to a relatively small number of precincts (49 in Ohio), and this limitation increases the statistical uncertainty. Second, the pollsters do not use a textbook formula to calculate their margins of error. Instead, they examine the actual deviations of their exit poll samples from past results in the same precincts. Ideally, all these deviations would be of the same size, in the same direction. (For instance, hypothetically, the poll might show Bush doing 2 points better everywhere in 2004 compared to 2000 -- although a result that neat would be extraordinarily unlikely.) The greater the variability in these deviations, the larger the margin of error.
So, the pollsters' estimates of uncertainty (margins of error) were relatively large because the precinct-level results varied widely, compared with past returns.
This wide variation could be an indicator of problems with the exit poll interviews. (One source of variation is that, as I mentioned, some of the polling places contain multiple precincts. Because the interviewers have no way to tell which voters come from which precincts, they interview voters from all the precincts -- but the interview results are compared with past returns from the "intended" precinct only.)
TIA:
E-M provides cumulative vote totals from 1250 precincts. An individual precinct MoE is not relevant. The Law of Large Numbers still applies. E-M clearly indicate the margin of error for various sample sizes in the NEP Methods statement table.
That table (on page 2 of the national methods statement) applies to percentages in the tabulations, not to the vote projections.
TIA:
The final exit poll “projections” are forced to match the recorded vote count. And what if the vote count is corrupted? So much for the “projections”. Read the Edison - Mitofsky notes at the bottom of the 12:22am NEP screen shot.
3.8. Doesn't everyone agree that the exit poll results were outside the
margin of error?
Yes: overall, and in many states, the exit poll results differed from the official results by beyond the margin of error, overstating Kerry's performance. (This overstatement is often called red shift, meaning that the "red candidate" Bush did better in the official returns than in the exit polls.) For instance, I noted above that in Ohio, Kerry led in the best interview-only estimate by 6.5 points with a "standard error" of 3.9 points. A 95% confidence interval for the margin is about double the size of the standard error: plus or minus 7.8 points. So Kerry's lead was less than the margin of error, and Ohio was too close to call based on the interview data (even if the pollsters accepted nominal 95% confidence, which they don't). However, since Bush officially won Ohio by 2.1 points, the exit poll discrepancy in Ohio (based on this estimate) was 8.6 points. That discrepancy is beyond the margin of error, at least at a 95% confidence level.
As I mentioned earlier, it turns out that at least the last five presidential exit polls have had overall discrepancies (measured as Within Precinct Error) outside the margin of error, but the 2004 discrepancies were the largest. We don't know how many states were outside the margin of error.
TIA:
Based on the 12:22am exit polls, the Margin of Error was exceeded in 16 states – all in favor of Bush. Based on the E-M provided average state WPE’s, the MoE was exceeded in 29 states.
Once again, your facts are wrong. The 12:22am Ohio exit poll discrepancy from the recorded vote was 3.12% - not 8.6%. Kerry led the 12:22am Ohio Exit Poll by 52.06 - 47.94%. Bush “won” the recorded vote by 51.06-48.94%. Assuming zero cluster effect, the margin of error was 2.21% for 1963 respondents; the exit poll discrepancy was 0.91% beyond the MoE. Assuming a 30% cluster effect, the MoE was 2.87% - still below the 3.12% discrepancy. Bush won the Final Ohio Exit Poll of 2020 respondents by 50.94-49.06%, but the vote shares and weights were forced to match the miscounted Ohio recorded vote. This was just like the final 2pm NEP in which vote shares and weights were changed from the 12:22am timeline to match the miscounted National vote.
But the exit poll matched the results of two independent models. The first was based on 12:22am NEP vote shares with weights adjusted to the Ohio 2000 recorded vote less the national 3.5% mortality rate and 95% turnout assumptions. Kerry was the 51.74-48.26% winner, within 0.32% of the exit poll. The second model was based on uncounted (3%) and switched vote (6.15%) assumptions applied to the recorded vote. Kerry was the 52.6-47.4% winner. A statistical analysis of actual ballots in Ohio’s Cuyahoga County (Cleveland) indicated that 6.15% of Kerry’s votes were switched.
3.9. Aren't survey results far outside the margin of error prima
facie evidence of fraud?
Margins of "error" refer to random sampling error. Most survey researchers would say that results outside the calculated margin of error most likely evince non-sampling error in the survey, such as non-response bias, sampling bias, or measurement error. The statistical "margin of error" assumes an unbiased sample, but competent survey researchers are rarely in a position to assume that they actually have unbiased samples.
Many people are under the mistaken impression that larger surveys are inherently more accurate. Larger surveys do have smaller margins of (sampling) error,
but they are not inherently less vulnerable to non-sampling error. For instance, the 1936 Literary Digest presidential poll had a huge sample size of over 2.2 million respondents (out of 10 million post cards mailed), giving it a nominal margin of error of less than 0.1%. In the poll, Alf Landon held a dominating lead over Franklin Delano Roosevelt, with 57% of the projected vote. In the actual election, Landon got under 37%. The statistical odds against this outcome appear to be larger than anything ever reported by TruthIsAll. But the sample was not random: the mailing lists used to address the post cards tended to favor more prosperous voters, and in 1936 this class bias turned out to be catastrophic.
(People sometimes misinterpret these points as arguing that we should assume that fraud did not occur in 2004 -- whereupon they protest that other evidencce
points to fraud in 2004. But my point here has nothing to do with whether fraud occurred in 2004. It is about whether large survey errors should be interpreted
as evidence of fraud.)
TIA:
Did you really mean to say “vote count” errors and not “survey” errors? The 1936 presidential poll only illustrates that polling was in its infancy. Scientific polling was unheard of. Since then, pollsters have constantly IMPROVED their methodology through sophisticated sampling techniques. Bush election fraud
has given polling a bad name. It’s the institutionalized uncounted and switched electronic votes which are the major cause of the polling discrepancies. But the fraud is not limited to these factors. Voter disenfranchisement works heavily against the Democrats even before the votes are miscounted. If all the votes were counted and everyone eligible was allowed to vote, the Democrats would win every election.
3.10. Which states had the largest exit poll discrepancies? Wasn't it
the battleground states?
No, the largest exit poll discrepancies were generally not in battleground states. Using the "IM WPE" statistic (which averages the WPEs for all precincts in each state, as opposed to other methods that trim extreme values), the largest discrepancies were in Mississippi (-18.5), Connecticut (-16.0), Delaware (-15.9), Vermont (-15.2), and New Hampshire (-14.0). Using the actual interview-only projections, the largest discrepancies were in Vermont (-16.5), Delaware (-16.0), New York (-13.9), New Hampshire (-13.6), and Mississippi (-13.1). Of these six states, only New Hampshire was a battleground state. (It is true, however, that the average discrepancy in the battleground states was larger than the average discrepancy in other states. Edison/Mitofsky report that at the precinct level, the average WPE was -7.9 for precincts in 11 "swing states," and 'only' -6.1 for precincts in other states.)
TIA:
First of all, let’s get the magnitude of the discrepancies right. Your discrepancy is margin-based. That is misleading. For instance, the NY exit poll said that Kerry won by 64-35%. The recorded vote was 58.5- 40.1%, a 4.5% Kerry discrepancy, far below your 13.9% figure. In 2000, Gore won by 60-35% with 5% for Nader/other. According to the National Exit Poll, approximately 71% of Nader 2000 voters voted for Kerry and 21% for Bush. So let’s allocate the Nader vote: 75% to Kerry and 25% to Bush. Assuming Kerry matched Gore’s 61% vote and picked up an additional 3% from returning Nader voters, his true NY vote share was 61+3% = 64%. matching the “pristine WPE-adjusted Exit Poll. It implies that fraud (uncounted and switched votes) cost Kerry 5.5% (64-58.5%).
TruthIsAll FAQ: (4)
Explaining
the Exit Poll Discrepancies
4.1. How did the exit pollsters explain the discrepancies in 2004?
In their evaluation
report, they stated that the Within Precinct Error was "most likely
due to Kerry voters participating in the exit polls at a higher rate than Bush
voters" (page 3). They further state, "It is difficult to pinpoint
precisely the reasons that, in general, Kerry voters were more likely to
participate in the exit polls than Bush voters. There were certainly
motivational factors that are impossible to quantify, but which led to Kerry
voters being less likely than Bush voters to refuse to take the survey. In
addition there are interactions between respondents and interviewers that can
contribute to differential non-response rates" (page 4). The evaluation
report lists several factors that were associated with differences in WPE,
including interviewer distance from the polls; interviewer age and education;
number of precincts at the polling place; and sampling rate at the polling
place. It does not offer a master theory of the discrepancy.
TIA:
What about the fact that discrepancies are caused by uncounted and miscounted votes? Why don’t the exit pollsters even mention that? Why did they ignore the fact that their own data indicated a slight Bush bias? Why didn’t they provide a rationale for the fact that paper ballot precincts had a low average WPE compared to the touch screens, levers and optical scanners?
4.2. What is the "reluctant Bush responder" (rBr) hypothesis?
First of all, it is a name coined by critics. What the pollsters concluded in the evaluation report was simply that Kerry voters apparently participated at a higher rate. That statement doesn't entail that Bush voters recoiled from the interviewers. It is possible that some Bush voters did steer around interviewers, and/or that some Kerry voters steered toward interviewers, and/or that some interviewers subtly favored Kerry voters over Bush voters. The statements I quoted above do emphasize non-response bias -- i.e., that Kerry voters were less likely to refuse than Bush voters were. Sampling bias by interviewers (approaching more Kerry voters than Bush voters) could also contribute to a difference in participation rates.
The evaluation report never refers to "reluctant Bush responders." In fact, it doesn't venture any specific motivations -- reluctance, eagerness, fear, enthusiasm, defiance, shyness, or anything else. This reserve is appropriate because, after all, the exit pollsters did not interview the non-respondents, and therefore they cannot know specifically why the non-respondents did not respond. (Indeed, even being able to interview the non-respondents might not help very much.)
TIA:
The exit pollsters “concluded” that Kerry voters participated at a higher rate? Where is the evidence to that effect; the exit poll data implies a Bush bias (see Freeman). Could the discrepancy simply be due to Kerry voters outnumbering Bush voters? Once again, the exit pollsters had to conjure up an explanation of why the polls were “wrong” without considering the very real probability of fraud. But since the polls didn’t match the recorded vote, they assumed that the vote count was accurate, so…they adjusted exit poll weights and vote shares to match the vote count.
4.3. Does the participation bias explanation assume that fraud is
unthinkable?
I will present several lines of argument that participation bias accounts for much of the exit poll discrepancy, and that fraud does not. (By the way, concluding that fraud doesn't account for the exit poll results isn't the same as ruling out fraud generally.) The pollsters had several good reasons to suspect from the outset that participation bias was important. First of all, non-response bias -- and other forms of non-sampling error -- are ubiquitous concerns in survey research. Survey researchers do not assume that their data are accurate within the computed "margin of error," because they are well aware of everything that can go wrong. Second, the national exit polls' history of overstating the Democratic vote share in precincts, as described in point 3.2, gives additional reason to consider participation bias likely.
Also, we know that the exit pollsters tested a specific hypothesis about massive fraud: that millions of votes were stolen on electronic voting equipment (Direct Recording Electronic machines and/or optical scanners). In the evaluation report, the pollsters state, "Exit polls do not support the allegations of fraud due to rigging of voting equipment. Our analysis of the difference between the vote count and the exit poll at each polling location in our sample has found no systematic differences for precincts using touch screen and optical scan voting equipment. We say this because these differences are similar to the differences for punch card voting equipment, and less than the difference for mechanical voting equipment." (pages 3-4) That is, the largest exit poll discrepancies on average were in precincts with lever machines. Granted, it might be possible to steal many, many votes on lever machines, but as far as I know, no one predicted or suspected it. Again, below I present other lines of argument that tend to point toward participation bias, and away from fraud, as explaining the exit poll discrepancies.
TIA:
There was no difference in WPE between touch-screens and optical scanners? They are really reaching with that one. That only means that both machines were rigged. Optical scanners results are fed into central tabulators, just like the touch screens. Were the central tabulators rigged? And what was the WPE in paper ballot precincts? How does it compare to the machines?
4.4. Don't the high completion rates in "Bush strongholds"
disprove the rBr or bias hypothesis?
No, and I'm amazed how much mental effort has gone into elaborating this very weak argument. Here is the argument: The reported completion rate in precincts that voted 80%+ for Bush ("Bush strongholds") was 56%. The reported completion rate in precincts that voted 80%+ for Kerry was only 53%.
So how can anyone claim that Kerry voters had a higher completion rate than Bush voters? Doesn't it appear that Bush voters had a higher completion rate?
One can work a lot of math into the argument, but basically the math is irrelevant. It seems that either one finds this argument compelling or one doesn't, regardless of the numbers attached. As a matter of logic, the argument has no force.
It is perfectly possible -- even likely -- that both Kerry voters and Bush voters completed the exit polls at a somewhat higher rate in "Bush strongholds" than their counterparts in "Kerry strongholds." The evaluation report suggests (on page 31) that "hypothetical completion rates of 56% among Kerry voters and 50% among Bush voters overall would account for the entire Within Precinct Error that we observed in 2004," but no one believes that those rates could apply everywhere. Indeed, the reported state-level completion rates ranged from 42.7% in South Dakota to 66.7% in Tennessee (pages 54-55) -- so we can be pretty sure that that both Kerry and Bush voters in Tennessee participated at a higher rate than their counterparts in South Dakota! Since Kerry did better in Tennessee than in South Dakota, can we conclude that Kerry voters had a higher completion rate overall? Absolutely not -- and if even the suggestion seems strange to you, then the "stronghold" argument should seem strange for the same reason. Comparing the overall completion rates in "Bush strongholds" and "Kerry strongholds" simply cannot tell us whether Kerry or Bush voters participated at a higher rate within either -- much less nationwide.
TIA:
Once again, you confound the basics. A Linear regression analysis of state exit poll response vs. poll and recorded/vote share indicates this relationship: exit poll response rates decreased going from Bush states to Kerry states, while Kerry’s poll and vote shares increased. To you, the regression analysis is irrelevant, but it disproves your case. The regression tells us that non-responders were more likely to be Kerry voters.
4.5. How can you explain the impossible changes in the national exit
poll results after midnight?
First to explain the "problem": The tabulation of the national exit poll at 7:33 pm on election night, based on 11,027 respondents, indicated that Kerry had a 3-point edge. The tabulation was later updated; a version time-stamped 12:22 am (just after midnight) showed 13,047 respondents, and one can infer that Kerry still leads by 3 points. The final tabulation, still available on CNN.com, reports 13,660 respondents and shows Bush ahead by approximately 3 points, as in the official returns.
At times TruthIsAll and others have suggested that these results are "impossible" in the sense that an additional 613 respondents cannot account for the shift from Kerry to Bush. Indeed they cannot. As I explained above, the tabulations are periodically updated in line with the projections -- and, therefore, in line with the official returns. The tabulation would have been updated even if there had been no additional respondents. So the whole idea of "impossible changes" is a red herring.
TIA:
You are creating the red herring by failing to mention that the FINAL EXIT POLL WAS FORCED TO MATCH THE VOTE COUNT – COME HELL OR HIGH WATER. THE FACT THAT THE “HOW VOTED IN 2000” WEIGHTS WERE MATHEMATICALLY IMPOSSIBLE, AND CORRESPONDING VOTE SHARES NOT PLAUSIBLE, WAS NEVER A CONSIDERATION.
Interested readers should refer to the DU Game thread in which you were finally forced to provide a plausible rationale for the Bush “mandate”. Unfortunately, you only succeeded in proving that there was none. Because you had to finally agreed that the 43/37 weightings were impossible, you had to force Bush vote shares much higher than they were in Final Exit Poll where they were already inflated to match the votes. So you compounded the fakery by hypothesizing that 14.6% of Gore voters defected to Bush in 2004. The 12:22am National Exit Poll said that 8% did – a 6.6% discrepancy. The margin of error assuming a 90/10 vote split for 3200 respondents is 1.7%.
4.6. Why were the tabulations forced to match the official returns?
If the official returns are more accurate than the exit polls -- and bear in mind that exit polls have been (presumably) wrong in the past -- then weighting to the official returns should, generally, provide more accurate tabulations. Weighting results to match known characteristics of the population (in this case, the voters) is called "post-stratification," and it is standard statistical practice. Of course, if the exit polls were more accurate than the official returns, then weighting to the official returns would provide less accurate tabulations. But even if one believes that they were, I see no reason to conclude that the exit pollsters thought so.
TIA:
Exit polls were presumably wrong in the past? Or was it the vote count? Could the “errors” have been a result of uncounted and miscounted votes? If demographic weightings are designed to match the population, then why were MATHEMATICALLY IMPOSSIBLE 43% Bush / 37% Gore weights used in the Final Exit Poll? Post-stratification or post-misinformation? You see no reason to believe that the exit pollsters were aware of the significance of the demographic impossibility? They HAD to match the vote count, so they were well aware. And so they went along with the Big Scam.
4.7. Wasn't there an effort to cover up the exit poll discrepancies?
Not that I can see. The original tabulations were online for many hours, at the hardly obscure CNN.com. Exit pollsters commented on the results for reporters, and Warren Mitofsky appeared on PBS's NewsHour three days after the election. The exit poll discrepancies were not secret.
TIA:
The preliminary exit polls notes say that they were “not for public viewing”. Without the 12:22am download from Jonathan Simon, we would never know the true exit poll results.
4.8. Is there any specific reason to think that the exit poll
discrepancies don't point to fraud?
There are several. One of my favorites is based on TruthIsAll's observation: "Based on the pre-election polls: 41 out of 51 states (incl DC) deviated to Bush. Based on the exit polls: 43 out of 51 deviated to Bush." As I discussed in Point 1, TruthIsAll's analysis of the pre-election polls is idiosyncratic: for instance, he estimated an 85% probability that Kerry would win Ohio, although only one poll out of the last ten put Kerry ahead there. Nevertheless, if the two sets of deviations tended to coincide -- if, for instance, Bush tended to do much better than the pre-election polls in the same states where he did much better than
the exit polls -- then one might judge that both sets of results tended to point to fraud. (Note: this argument assumes that the extent of fraud varied from state
to state, and that the differences in exit poll discrepancies partly reflect differences in fraud.)
Interestingly, as I show here, the relationship between these two deviations (official vs. pre-election polls, and official vs. exit polls) is flat to negative. That is, if anything, exit poll "red shift" overstating Kerry's support was largest in states where he did better than predicted in pre-election polls, or at least no worse. These results are calculated using TruthIsAll's own pre-election poll measures! While many people (including TruthIsAll) have asserted that pre-election polls may be biased, no one has explained why some state polls would be more biased than others, in a pattern that would cancel out the evidence of fraud. The lack of a positive correlation between these two deviations isn't strong evidence against fraud in any particular state, but it appreciably weakens the case that the exit polls point to fraud around the country. (A more detailed exploration of the data is here.)
Another strong reason to think that the exit poll discrepancies do not point to fraud involves the "swing" statistic. "Swing" is the percentage change in Bush's performance from 2000 to 2004, in each exit poll precinct. Swing tends to be fairly small, generally within a range of plus-or-minus 10 points. Generally, if an exit poll "red shift" of (say) 30 points tended to indicate 30-point fraud favoring Bush, then one would expect swing favoring Bush to be larger in such precincts than in precincts where the exit polls closely matched the official returns or even overstated Bush's support. But in fact, as I show here, there is essentially no correlation whatsoever between "swing" and "red shift." This result is hard to reconcile with fraud in the exit poll precincts, unless the fraud was precisely targeted in precincts where Bush would otherwise have done worse than in 2000.
TIA:
The naysayer swing vs. red-shift scatter
chart flat regression line is the rationale for claiming that the
exit poll discrepancies had little effect and therefore fraud was unlikely. But
it is not supported by the mathematics; there are an infinite number of
scenarios which would invalidate the premise. And you are comparing apples
to oranges; you did not adjust the 2000 recorded vote. According to the 2004
National Exit Poll, Kerry won 71% of returning Nader voters compared to 21% for
Bush. A similar split would have increased Gore’s margin by
1.4m. Assuming that 75% of approximately 3 million uncounted votes were
for Gore, his margin increases by another 1.5mm. When added to his recorded
540,000 vote majority, Gore’s adjusted margin becomes 3.4m.
And we have not yet considered the effects of vote-switching. Thanks to Ohio, we know a lot more about vote-switching than we did in 2000. It’s very likely that Gore votes were switched to Bush. If 3% (1.5 million) were switched, then his final adjusted margin is 6.4 million: 3m switched + 1.5m uncounted + 1.4m Nader + 0.54m recorded.
You never normalized the 2-party state vote shares in calculating “swing”. Assuming 3% vote- switching from Gore to Bush, swing exceeded red-shift in 43 states. Average adjusted state swing was 4.0%; average red-shift, 1.5%. Weighted average adjusted swing was 3.74%; weighted average red-shift, 1.41%. Assuming zero vote-switching in 2000, adjusted swing exceeded red-shift in 32 states. Average adjusted swing was 2.58%; weighted average swing was 2.39%.
An adjusted
swing vs. redshift bar graph displays the deviations.
Another scatter
chart shows that adjusted swing exceeded 4% in 18 states while
red-shift exceeded 4% in only 2 states. The naysayer swing vs. red-shift
argument is just another ruse meant to divert, confuse and mislead.
The recorded 2000 vote needs to be adjusted by these factors:
1) Third-party (Nader) share of 2000 voters:
According to the National Exit Poll, Kerry won returning Nader 2000 voters by 71-21% over Bush. We need to revise the 2000 vote totals accordingly by allocating the Nader vote to Gore and Bush in the same proportion.
2) Uncounted votes:
According to the 2004 Election Census, there were 125.7mm total votes cast but only 122.3mm were recorded; 3.4mm (2.74%) were uncounted. In 2000, there were 104.7mm votes recorded. Assuming that the 2000 uncounted vote rate was equal to the 2004 rate, then 107.7mm total votes were cast and 3.0mm were uncounted. Since the majority of uncounted ballots are found in Democratic minority districts, a fair assumption is that 75% of these uncounted votes were for Gore. There were 180,000 spoiled ballots (under and over votes) in Florida.
3) Switched votes:
The True Vote Model base case scenario indicates that 6.8% of total votes cast for Kerry were switched to Bush. An exhaustive review of the ballots in Ohio's Cuyahoga County determined that 6.15% of Kerry’s votes were switched. For this analysis, the best case assumption is that 3.0% of Gore votes were switched.
4.9. Is there any specific reason to believe that participation bias does
explain the discrepancies?
Yes, beyond the facts that participation bias is common, that past exit polls have overstated Democratic performance, and that the exit poll discrepancies
don't correlate with pre-election poll discrepancies, "swing" from 2000, or electronic voting machine use, there is also some evidence indicating participation
bias in 2004. Specifically, some patterns in the exit poll discrepancies fit well with participation bias.
For instance, "red shift" is much greater in precincts where interviewers stood further from the polling place. The average WPE increases from -5.3 where interviewers stood inside the polling place to -12.3 where interviewers stood more than 100 feet away (evaluation report, p. 37). This result is consistent with the conjecture that Kerry voters were more eager to participate in the exit polls than Bush voters were -- and this disparity was more manifest in polling places where it was easier to avoid the interviewers entirely. The recorded completion rate falls from 59% where interviewers stood inside the polling place to 43% where they were more than 100 feet away; both refusal and "miss" rates go up. At that distance, the "random sample"
becomes largely voluntary.
(Some people have objected that interviewer distance cannot account for the error in the poll because the WPE is so large even when interviewers stood inside the polling place. This misses the point. Edison/Mitofsky never asserted that interviewer distance accounts for non-response bias. If Bush voters and Kerry voters are equally willing to participate in the survey, then distance should not matter. But if they differ overall in their willingness to be interviewed, then it makes sense that greater distance would accentuate the difference.)
"Red shift" is also much larger at polling places with high interviewing rates -- that is, where interviewers were supposed to skip more voters between interviews (evaluation report, p. 36). Interestingly, however, the reported completion rates were not lower at these polling places. So it appears hat interviewers at these polling places sometimes (probably unawares) ended up interviewing Kerry voters when they "should have" interviewed Bush voters. Indeed, there is anecdotal evidence that some interviewers did not rigorously enforce these interviewing rates, but rather sometimes interviewed voters who seemed more cooperative.
Red shift also varies with certain interviewer characteristics, such as age and education (evaluation report, pp. 43-45); it appears that interviewers who were college students were especially prone to biased results. Voters may have tended to assume that college students would be Kerry voters, and gravitate toward
or away from them accordingly.
TIA:
Red-shift or red-herring? Check this graph of Kerry State Vote vs Exit Poll vs. Completion Rate. As we move from high completion rate states to low completion, Kerry’s vote and poll shares increase. This is a graphic contradiction of the Bush voter non-response theory.
________________________________________________________________
4.10. Aren't you offering a lot of unproven speculation?
You could call it that, or you could call it scientific reasoning on the basis of incomplete evidence. William Jennings Bryan once said that "Darwinism... is only a guess and was never anything more" -- but Bryan made no systematic attempt to consider how well "Darwinism" explained a broad variety of evidence, compared with the explanatory power of alternative theories. Attributing outcomes to the unfathomable will of God "explains" them by eschewing any attempt to understand them. In practice, attributing exit poll outcomes to fraud often suffers the same limitation. People who insist that the exit polls evince fraud have made little or no attempt to explain, for instance, why the exit poll discrepancies vary with interviewer age and education, or why the exit polls point to double-digit fraud in New York, a lever-machine state where Bush had no chance of winning, and where the official result is very close to pre-election predictions.
Given all the respects in which participation bias fits the data, and in which massive fraud does not, it is hard to understand how anyone can argue straight-faced that participation bias is the more speculative theory.
TIA:
The exit polls point to double-digit fraud in NY? That’s misleading. According to the exit poll, Kerry won NY by 63-36%. The recorded vote was 58.5- 40.1%, a 4.5% discrepancy. In 2000, Gore won NY by 61-35% with 4% of the vote going to Nader. According to the NEP, 71% of Nader 2000 voters switched to Kerry in 2004; just 21% voted for Bush, a better than 3-1 ratio. Let’s assume that Kerry matched Gore’s 61% and won 75% of Nader 2000 voters. Then Kerry won by 63-36%, matching the Exit Poll. And yes, there is evidence that Lever machines are vulnerable to miscounts at the voting machine and central tabulator.
4.11. Are you saying that the exit polls disprove fraud?
No. As noted earlier, many forms of fraud may be compatible with the exit poll results. However, it seems hard to reconcile massive, widespread fraud – on the order of many millions of miscounted votes -- with the exit poll results unless one begins by discounting the details of the exit poll results. By and large, the exit polls point to fraud in bizarre places (Delaware?) and sizes (how likely is it that Kerry would have won New Hampshire by double digits – or New York by over 30 points?). One can explain away some of these results individually, but the entire pattern simply isn't very consistent with massive, widespread fraud.
TIA:
How likely is it that Kerry won NY by over 30 points? As we have shown, Gore won NY by 60-35% over Bush, with the remaining 5% to Nader/other. It’s very conceivable that Kerry at least matched Gore and won 75% of the Nader vote to end up with a 64-35% margin.
4.12. Are you saying that you are sure Bush didn't steal the election?
No, depending on what one means by "steal." In particular, I think it is at least possible that some combination of vote suppression (purges, long lines, intimidation, etc.) and uncounted votes cost John Kerry a victory in Ohio, and therefore in the election. (Obviously "uncounted votes" can be regarded as a form of vote suppression.) I doubt it, but I am not arguing against it here. Many forms of vote suppression would not even affect the exit poll results, if they discouraged people from coming to the polls in the first place. It is easier to believe that Kerry "could have" won Ohio than to believe that he should have won by over 6 points despite vote suppression, as the exit poll indicates.
Please note: I think that efforts to prevent people from voting, or to prevent their votes from being counted, are despicable regardless of whether they affect the outcome.
TIA:
Please note: switching votes electronically from Kerry to Bush is also despicable.
Go here for an analysis of Uncounted and Switched Votes
TruthIsAll FAQ: (5)
5.1. Why has TruthIsAll called the "2000 presidential
vote" question the clincher?
About 3200 exit poll respondents around the country were asked who they voted for in 2000. The weighted results look like this (screen shot excerpted from cnn.com): http://www.geocities.com/electionmodel/TruthIsAllFAQimage002.jpg
TIA emphasizes two aspects of this table. First, he notes, it is impossible that 43% of the 2004 electorate voted for Bush in 2000.
That would be over 52 million Bush voters, whereas Bush only got about 50.5 million votes in 2000. (Some of those voters must have died, or not voted for other reasons.) Ergo, it is necessary to apply "mathematically impossible weights" to the exit poll data in order to match the official returns, and so Kerry must actually have won. I will call this the "impossible 43%" argument.
Second, he argues: if the previous election's Gore voters and Bush voters turned out in roughly equal numbers in 2004, and if they 'defected' in 2004 to the other party at roughly equal rates, as in the table (10% of Gore voters to Bush, 9% of Bush 2000 voters to Kerry), and if Kerry won among the "Other" voters (mostly Nader voters) and those who did not vote, then Kerry must have won.
The second argument is especially appealing to many people who regarded the 2004 election as in some sense a replay of the 2000 election. It seems very reasonable to say that if Kerry could just battle to a stalemate among the previous election's Gore and Bush voters, the Nader voters and new voters were bound to put Kerry over the top.
5.2. What is wrong with the "impossible 43%" argument?
It assumes that exit poll respondents accurately report whom they voted for in the previous election. In reality, exit poll respondents seem to have overstated their support for the previous winner in every exit poll for which I could obtain data, ten in all, going back to 1976. (Yes, even Richard Nixon, despite resigning in disgrace, garnered a higher "recalled vote" percentage in 1976 than his official vote share in 1972!) In fact, TIA's first argument could just as well be applied to 2000: in that year, proportionately more exit poll respondents recalled having voted for Clinton in 1996 than could actually have done so.
Lots of other evidence indicates that people often report having voted for the previous winner although they didn't. Perhaps most telling is an (American) National Election Study (NES) "panel" in which people were interviewed soon after the 2000 election, and then reinterviewed in 2004. Of the people who said in 2000 that they had voted for Gore, about 7% said in 2004 that actually they had voted for Bush in 2000. (A smaller proportion, under 2%, similarly "switched" from Bush to Gore.) Also, among those who said in 2000 that they hadn't voted for president, about 36% said in 2004 that they had voted and those respondents reported voting for Bush by about 2 to 1. For several reasons, these percentages cannot be directly applied to the exit polls.Nevertheless, the panel does provide direct evidence of people misreporting their past votes, in Bush's favor.
So, while it is impossible that 43% of voters in 2004 actually voted for Bush in 2000, it is not at all impossible that 43% of voters would report having voted for Bush in 2000. In fact, this overstatement of past support is consistent with past exit poll results; it would be surprising if the percentage were not "too high."
TIA:
Ah, the “false recall” argument that people often report voting for the previous winner. But in 2000 GORE won by 540,000 votes in the official count. You cite the 2000 exit poll in which 45.5% respondents (48.1 of 104.74m) said they voted for Clinton in 1996. His recorded vote was 45.6m. How do we account for the 2.5m discrepancy?
Once again, you assume that Clinton’s 45.6m recorded vote was correct. Remember the uncounted votes? We need to compute Clinton’s true 1996 vote. The recorded vote was 91.3 million. If 3% of the total votes cast were uncounted, then 94.1m votes were cast; 2.8mm were uncounted. Assuming 2.1m (75%) of the uncounted votes Clinton’s, his true vote was 47.7m , a 0.40mm deviation (0.83%) from the 48.1mm exit poll. That’s well within the 1.0% MoE.
In any case, it doesn’t matter what 2004 exit poll respondents said as to how they voted in 2000. The maximum number of returning 2000 voters in 2004 is limited to those who were still living in 2004. You have agreed to this simple fact, so false recall is a non-issue. It comes down to this: where did Bush find 16 million new votes? Assuming that 95% (46.5 of 48.7) million Bush 2000 voters also voted in 2004, he needed 62-46.2= 15.8 million new voters to match his 2004 recorded vote!
The second argument assumes that Kerry did about as well among Bush 2000 voters as Bush did among Gore 2000 voters. Superficially, the exit poll table supports this assumption. And many Democrats cannot believe that any appreciable number of Gore 2000 voters -- presumably outraged by the Supreme Court's intervention, not to mention countless Bush actions -- would actually vote for Bush in 2004.
But the problem with the first argument is crucial to understanding the problem with the second: one cannot assume that people have reported their past votes correctly. Among the people who reported having voted for Gore, only about 10% "defected" to Bush. But what about the people who actually voted for Gore in 2000 but reported having voted for Bush? One would expect that in 2004, such people would be more likely to vote for Bush than for Kerry. Indeed, in the 2000-2004 NES panel, this group favored Bush over Kerry by greater than a 5-to-2 ratio. Thus, the 10% Gore-to-Bush "defection rate" is understated, because it excludes people who actually voted for Gore in 2000 (but misreported this fact) and who voted for Bush in 2004.
By similar logic (also supported by evidence from the NES panel), the 9% "defection rate" of Bush 2000 voters to Kerry is somewhat overstated. It includes some people who actually voted for Gore, but reported having voting for Bush (in 2000) -- and then voted for Kerry! This finding maay seem strange: one might imagine that people who misreported having voted for Bush in 2000 would invariably support Bush in 2004. But, as I just noted, this is observably not the case in the NES panel. Some people seem simply to forget having voted for Al Gore in 2000, but nonetheless end up (apparently) voting for Kerry.
(Kerry's margin among "new voters," i.e., people who did not vote in 2000, is probably also overstated, because some actual new voters who voted for Bush will have reported voting for Bush in 2000 as well. Of course I am leaving out several permutations of actual and reported votes!)
While there is no way of knowing the true defection rates, I estimate that the data are consistent with a Bush-to-Kerry defection rate of about 7-8% and a ore-to-Bush defection rate of about 14%. For a more extensive discussion, see my paper, "Too Many Bush Voters?"
This argument is consistent with the fact that the pre-election national polls generally gave Bush a slight lead. Kerry was widely expected to do better than Bush among new voters -- so if these new voters were going to break a stalemate in Kerry's favor, they should have done so in the polls before the election. (Many people tend to discount this point because they assume that the pre-election polls somehow missed these new voters -- perhaps because the pollsters underestimated turnout and/or because many of the new voters were cell-phone-only users. I address both these arguments above.)
TIA:
Wow! That can only be described as a convoluted, faith-based set of hyper-hypotheticals. And this is where we part company. For one to believe that over 7 million Democratic Gore voters would defect and vote for the most incompetent, dishonest pRresident in history (with a 48.5% approval rating) who STOLE the 2000 election from them, is really a stretch – a perfect example of faith-based naysayer fundamentalism.
5.4. But... but... why would 14% of Gore voters vote for Bush??
If one thinks of "Gore voters" as people who strongly supported Gore and resented the Supreme Court ruling that halted the Florida recount, then the result makes no sense. For that matter, if one thinks of "Gore voters" in that way, it makes no sense that they would forget (or at any rate not report) having voted for Gore. Nevertheless, the NES panel evidence indicates that many did. (Of course, the figure may not be as high as 14% -- although it could conceivably be even higher.)
One has to consider that many Americans who vote in presidential elections do not follow politics very closely. Some will unenthusiastically opt for one candidate or the other late in the process; if they voted for the candidate who ultimately lost, they may literally forget him. (Mike Dukakis, the 1988 Democratic nominee, seems to have been singularly subject to this fate. Dukakis lost the election by under 8 points, but in the 1993 General Social Survey, he retrospectively lost by 41 points.) Considerable research indicates that incumbent presidents tend to have an inherent advantage, which might be characterized as a "devil-you-know factor." Ray Fair estimates that from 1916 through 2000, an incumbent running for reelection had about a 3-point boost in expected vote share, although this advantage seems to have declined since 1960.
Some observers argue that George W. Bush had a particular advantage in 2004 given his standing as a wartime president. Americans are said to be reluctant to vote against incumbents in wartime. I am ambivalent about this argument, but we do not need to arrive at a sound-bite explanation of why an appreciable minority of Gore voters defected to Bush in order to conclude that they did.
TIA:
You sure as hell do need a sound-bite explanation of why so many Gore voters defected to Bush; all evidence indicates the opposite. NES, NES, NES. (N)ot (E)xactly (S)cientific. That’s the essence of your case.
Take a look at the True Vote Model
TruthIsAll FAQ:
M.1. What about the reports of flipped votes on touch screens in 2004?
Many people reported difficulty voting on electronic voting machines (DREs), in particular, that attempts to vote for one candidate initially registered as votes for another. The Election Incident Reporting System (EIRS), connected to the "OUR-VOTE" telephone hotline, recorded close to 100 such incidents. TruthIsAll has asserted that 86 out of 88 reports of electronic vote-flipping favored Bush. He cites the odds of this imbalance as 1 in 79,010,724,999,066,700,000,000. Another observer reports that actually,
87 out of 94 EIRS reports favored Bush. The odds of this imbalance are, of course, still prohibitive -- on the order of 500 trillion to 1 against.
Is this compelling evidence of a stolen election? No, it really isn't at all -- because the actual election returns from DREs on crucial states don't support election theft concentrated upon DREs. In Florida, some analysts who looked for evidence of vote-switching on DREs concluded that the optical-scan results were actually more suspicious. (Of course, it is possible that both could be hacked.) In Ohio, most Ohioans voted on punch cards. Walter Mebane and Michael Herron, in an analysis of the Ohio returns for the Democratic National Committee's Voting Rights Institute, found no statistical evidence implicating either DREs or optical scanners in vote-switching. As noted earlier, the exit polls also fail to support the hypothesis of massive vote-switching on DREs -- unless one is prepared to stipulate even more massive vote-switching on lever machines.
One also wonders about the inherent plausibility of visible vote-switching as a means of widespread election fraud. If someone had the insider access to force visible vote-switching, wouldn't s/he also have the ability to engineer invisible vote-switching? This question may have a compelling answer, but I haven't seen one yet. (On the other hand, the mere fact that a fraud mechanism seems suboptimal doesn't prove that it wasn't used.)
While TIA's reported odds are breathtaking, they do not interpret themselves, for two reasons. First of all, the odds calculation depends on the underlying assumption that Bush-to-Kerry and Kerry-to-Bush switches were equally likely to be reported to EIRS. Actually, the EIRS hotline was widely publicized in liberal-leaning media sources, and the election protection volunteers who promoted the hotline were concentrated in heavily Democratic precincts. Given these facts, asell as pre-election concerns about Diebold and DREs, one would expect Kerry-to-Bush switches to be reported at a higher rate. But how much higher? There is simply no way of knowing. Certainly the imbalance of reports is suspicious.
The second problem is that these 88 or 94 reports are not a sample, but rather the universe of all EIRS vote-switching reports. (Presumably some additional vote-switching reports are not logged in the EIRS.) Moreover, most of these reports assert that the voter was ultimately able successfully to vote for the correct candidate. So, what is the likely frequency of vote-switching implied by the data? People who leap from fewer than 100 problem reports to multi-million-vote conclusions obviously are not following the data alone. Are these reports the tip of the proverbial iceberg, representing huge numbers of vote switches not detected or not reported? Again, there is simply no way of knowing. However, again, statistical analysis of the election returns generally indicates, probably not. Surely there were more problems than reported in the EIRS, and some of the problems may reflect tampering, but they seem to have had little impact on the outcome.
There is solid evidence of excessive "undervotes" on pushbutton DREs in New Mexico, disproportionately concentrated in Democratic precincts and presumably costing Kerry many net votes. The magnitude of this effect is unclear, but it possibly may have been large enough to reverse the outcome in New Mexico. The problem has been attributed in part to the implementation of the straight-ticket option on these machines: many voters may have inadvertently voided their presidential votes by initially selecting a straight ticket, then voting for another party's candidate elsewhere on the ballot.
M.2. Did the 2006 exit polls manifest "red shift" compared
with official returns?
Yes. For instance, the initial national House tabulation -- posted a bit after 7 PM Eastern time on election night -- indicates that Democratic candidates had a net margin of about 11.3 points over Republican candidates. The actual margin was probably about 7 points, depending on how uncontested races are handled.
TIA:
What is your justification for stating that “the actual margin was
probably about 7 points, depending on how uncontested races are handled”?
M.3. Do pre-election "generic" House polls in 2006 match the
initial exit poll returns?
Not really. A "generic" poll is one that asks respondents whether they would vote for (in Gallup's words) "the Democratic Party's candidate or the Republican Party's candidate," rather than naming specific candidates. (Typically the order is rotated: half of respondents are asked about Republicans first.) Generic polls are common because of the logistical complexity of (1) trying to match randomly dialed telephone numbers to congressional districts and (2) prompting the interviewers to pronounce the names of the candidates in each of the 435 districts -- for an average of perhaps two or three interviews per district. Nevertheless, in real life, voters choose between named candidates, not generic ones, and this distinction makes a difference. Joseph Bafumi and colleagues state (PDF page 6):
We know that they [the generic polls] perform poorly as point estimates. For instance, an 18-point Democrat lead from early in an election year most likely will translate into a far smaller vote lead on Election Day. However, regression equations accounting for the vote in terms of the generic vote do predict well, as they properly discount the exaggerated sizes of the generic poll leads.
What it means to "predict well" is a matter of perspective: Bafumi et al. report (PDF p. 2) that midterm House vote share predictions based on generic polls over the last 30 days have an estimated margin of error of plus-or-minus 3.7 points. Vote margin predictions therefore have a margin of error of more than 7 points.
The 2006 generic poll results varied widely. Seven polls conducted in the last week before the election agreed that the Democrats were ahead, but the estimated Democratic margin ranged from 4 to 20 points. The average margin in these polls was about 11.6 points. Using these polls in Bafumi et al.'s regression equation, we can estimate that the Democrats would win by about 8 points, with (as I mentioned) roughly a 7-point margin of error. (Bafumi et al., using generic polls through "early October 24," estimated that the Democrats would win by about 10 points based on an average margin of over 15 points in the polls to that date.)
David Moore and Lydia Saad noted in 1997 that the final generic Gallup poll has generally been more accurate than the generic-poll averages. They reported that from 1954 through 1990, the final Gallup poll had an average error of under 1.3 points on vote share (about 2.5 points on margin). (The 1994 through 2002 Gallup results were also close, on average, to the official totals, although the 1998 poll overstated the Democratic vote share by 2.5 points -- still within the margin of error.) The final Gallup poll in 2006 projected a 7-point Democratic margin.
Given statistical margins of error, these generic poll results could be consistent with a Democratic vote margin of 7 points or of 11-plus points -- although a 7-point margin is somewhat likelier than an 11-point margin. But we do not have to settle for the generic poll results. We can examine pre-election polls in particular House races. As Mark Blumenthal has demonstrated, overall these pre-election polls come very close to the actual returns. Thus, neither generic nor race-specific pre-election polls support the conjecture of widespread miscount in House races. (In Senate and gubernatorial races, Blumenthal showed earlier, Democratic candidates on average did as well as or better than in pre-election polls.)
TIA: Not Really? Let’s look at the evidence.
This analysis shows how the Final Exit poll weights were manipulated to cut the Democratic margin in half.
This analysis shows that the 120 Generic Poll Trend matched the7:07pm Exit Poll.
This is an analysis of uncounted and switched votes.
This analysis shows that the 120 Generic Poll Trend matched the 10 Final Generic Polls.
This is the final of three pre-election articles I wrote with Michael Collins (autorank) and Alistair Thompson of SCOOP. The purpose was to quantify the risk of fraud in the 2006 Mid-terms. The analysis forecast that the Democrats would gain control of the House and Senate. It also indicated the House seats and Senate races where fraud was most likely to occur.
M.4. What about the massive undervotes in Sarasota County, Florida
(C.D. 13)?
Without getting into the specifics, the short answer is: I think that if voters had been able to cast their votes as they intended, the Democratic candidate Christine Jennings would have won the House race in Florida's 13th Congressional District (FL-13) by thousands of votes, instead of losing by under 400. I have seen no evidence that the events in FL-13 shed light on outcomes in any other Congressional race.
TIA:
Are you implying that FL-13 was an isolated case of missing and/or switched votes? And that there is no evidence of miscounting in the other 434 districts? Mark, you’re in a constant state of denial. What about Ohio? There are quite a few articles which document the fraud.
This Pew 2006 Election Analysis of voting “glitches”, “snafus” and “hiccups” describes the chaos state by state.
This Survey of
Pollworker and Voter Experience Reveals Pervasive and Recurrent Failures among
Computerized Voting Systems.
An extensive analysis of ballots cast in the Ohio 2006 Senate Race by Richard Hayes Phillips, Ph.D. proved that the recorded vote count was imposssible.
ABSTRACT: In the November 7, 2006 election in Ohio there were 350,669 more ballots cast than the number of votes counted for United States Senator. In 16 counties there were 268,987 uncounted votes, or 19.46% of ballots cast, compared to 82,957, or 2.99%, in 71 other counties. Cuyahoga County alone accounted for 148,928 uncounted votes, or 26.48% of ballots cast in the county, and 42.47% of the statewide total of uncounted ballots. In Marion County there were 1,275 more votes counted for United States Senator than the reported number of ballots cast, which is an impossibility.
If the rate of uncounted ballots in the 17 suspect counties had been about 3%, as was the case elsewhere in the state, there would have been about 42,000 uncounted ballots instead of 269,000. This indicates that 227,000 votes may have been lost by the touch screen voting machines, which were utilized in all 17 of the suspect counties.
________________________________________________________________
Bush had a 48.5% average approval rating on Election Day.
The Nov.1, 2004 Election
Model, based on the final state and 18 national pre-election polls,
projected Kerry as the 51.8-48.2% winner of the two-party vote. His projected
337 electoral vote total was calculated as the average of a 5000 election-trial
Monte Carlo simulation. The projection model was confirmed by the state and
national exit polls.
Edison-Mitofsky provided four state exit poll measures. Kerry won the first three; Bush won the Final:
1) WPE 51.8-47.2% (unadjusted)
2) GEO 51.0-48.5% (adjusted to incoming recorded votes)
3) Composite 50.3-49.1% (12:22am-adjusted to pre-election polls)
4) Final 48.5-51.1% (matched to recorded vote)
WPE is the only unadjusted (‘pristine’) measure. It was based on the average discrepancy between the exit poll result and recorded vote for all state precincts which were polled. Measures (2) and (3) are adjusted estimates which incorporate pre-election polls and recorded votes. The final state exit polls were forced to match the recorded votes, therefore implying ZERO election fraud. Why should we believe them? And why bother doing exit polls at all if they will just assume that the recorded vote count was the True Vote?
Some say that exit polls are not designed to predict the True Vote but to provide a demographic snapshot of the electorate. But if that’s the case, and the recorded vote count is corrupted, then so are the demographics.
Kerry also had a steady 51-48% lead throughout the National Exit Poll timeline: at 4pm (8349 respondents); 7:30pm (11027); 12:22am (13047) - after the polls closed. Of course, Bush won the Final NEP by 51-48% (13660 respondents) which was posted at 2pm the day after the election. The Final NEP was forced to match the Recorded Vote count with impossible weights and implausible vote shares, so why should we believe it?
Excel–based models were developed to calculate the True Vote. Links to the models are provided in this
document. They confirm the massive
documented evidence of elections that were compromised by a combination of
uncounted and miscounted votes. The essential input for the models
include state and national recorded votes, pre-election and exit polls, Census
total votes cast and mortality rates. Users can enter their own assumptions and
then view a ‘sensitivity analysis’ of resulting state and national vote shares
and margins. The scenarios are displayed in numeric tables and charts. Many
examples are provided in this document.
The Election Calculator and Interactive Election Simulation models determined that Kerry probably did 1-2% better than the exit polls indicate.
The Election Calculator is an Excel model for analyzing 1988-2004 elections. Users can override the pre-set default assumptions for voter mortality, uncounted vote rates, prior election voter turnout and vote shares of prior and new voters. The base case scenario indicates that Kerry won by nearly 10 million votes with a 53.2-45.4% vote share. Interested readers can download the model, review the base case scenario and then enter their own assumptions. Sensitivity analysis tables provide an instant view of vote shares over a range of input assumption scenarios.
The Interactive 2004 Election Simulation Model (also Excel) enables users to run simulations based on state and national pre-election and exit polls. State exit poll vote shares are based on the following user options: 1) WPE, 2) Best GEO and 3) Composite (12:22am). The National Exit poll data includes the 12:22am update and the 2pm Final. The only pre-election model assumption is Kerry’s projected share of Undecided Voters. The only state exit poll inputs are the method (1, 2, or 3) and assumed cluster effect. A Monte Carlo simulation consisting of 200 election trials generates both the projected popular and expected electoral vote. The probability of Kerry winning the election is the percentage of trials in which Kerry received at least 270 EV. Additional model analysis includes National Exit Poll timeline, Gender vote, exit poll response optimizer, Census data and the Ohio exit poll.
In the 2006 midterms, a Democratic Tsunami gained 31 congressional seats. But they actually did much better than that. A regression trend analysis of 120 pre-election Generic polls (all won by the Democrats) projected they would win by 56-42% and gain over 40 seats. The 7pm National Exit Poll update (55 Dem-43% Rep) confirmed the pre-election trend. But the next day, the Final NEP was once again forced to match a corrupted vote count with implausible weights and vote shares. The Democratic margin was cut in half to 52-46%. The fraud resulted in the loss of 10-20 seats.
Dec.12, 2000 is a day that will live in infamy. Bush needed the help of five right-wing Republicans on the Supreme Court to stop the recount in Florida and enable him to steal the election. There has been an ongoing controversy regarding the 2004 election. State and national pre-election and exit polls pointed to a Kerry victory. Those who claim that Bush won fair and square are relentless in their attempts to thrash polling analyses which suggest that fraud occurred. Since the media will not release tell-tale precinct-level data, analysts must rely on publicly available polling data. And they have determined that the polls provide powerful statistical evidence of fraud. ’Voter fraud’ has been shown to be a non-existent distraction from the evidence of massive ‘election fraud’. Voters don’t fix elections, corrupt officials do. The corporate media was quick to dismiss the statistical polling analyses and claims of election fraud by ‘spreadsheet-wielding Internet bloggers’ as another left-wing conspiracy theory.
This is what Richard
Morin , a Washington Post staff writer, wrote on Thursday, November
4, 2004:
An Election Day filled with unexpected twists ended with a familiar question: What went wrong with the network exit polls? In two previous national elections, the exit polls had behaved badly. Premature calls by the networks in Florida led to a congressional investigation in 2000. Two years later, a computer meltdown resulted in no release of data on Election Day…. Results based on the first few rounds of interviewing are usually only approximations of the final vote. Printouts warn that estimates of each candidate’s support are unreliable and not for on-air use.….That is why the early leaks anger Joe Lenski of Edison Media Research, which conducted Tuesday’s exit poll with Mitofsky International for the National Election Pool, a consortium of the major television networks and the Associated Press…. After the survey is completed and the votes are counted, the exit poll results are adjusted to reflect the actual vote, which in theory improves the accuracy of all the exit poll results, including the breakdown of the vote by age, gender and other characteristics’.
The media never considered the possibility that the votes may have been miscounted and that the exit polls were essentially correct. They just took it for granted that the vote count was accurate (i.e. the election was fraud-free). After all, isn’t that why the exit poll results are always adjusted to match the vote count? Of course, they never did an analysis which would have shown that the adjusted Final NEP weights were impossible and that the adjusted vote shares were implausible. And they would have come to the same conclusion as the spreadsheet-wielding bloggers: the election was stolen.
A dwindling number of naysayers continue to argue that the exhaustive statistical analysis of 2004 pre-election and exit polls by a number of independent researchers does not provide convincing evidence that the election was stolen. Their ‘case’ consists of faith-based theories, factual avoidance, misstatements and misrepresentations. And they cannot reconcile the many statistical anomalies which all point to massive fraud. Some of their ‘explanations’ include the following: Kerry voters were more likely to respond to exit pollsters; exit poll interviewers sought out Kerry voters; over 7% of returning Gore voters told the exit pollsters that they voted for Bush in 2000; pre-election and exit polls are not pure random samples; exit polls are not designed to detect fraud in the United States; early exit poll results overstated Kerry’s vote; women voted early and Republicans voted late; Gore voters defected to Bush at twice the rate that Bush voters defected to Kerry. None are supported by factual data and all have been refuted.
Uncounted Votes
In every election, millions of mostly Democratic votes are never counted – and are a significant contribution to the exit poll discrepancies. According to the 2000 Census, approximately 5 million votes were never counted. Since they were from heavily democratic minority districts, if Gore won 75% his true margin was close to 3 million votes - not the 540,000 recorded. And that does not include the very real possibility that a certain percentage of recorded Gore votes were switched to Bush. The 2000 election was not even close, although the media would like us to believe it was. Only the 5-4 Supreme Court decision was close. Consider the Florida 2000 fiasco. Bush ‘won’ by 537 ‘official’ votes - before the recount was aborted. But 185,000 spoiled (under and over-punched) ballots were never counted. Since approximately 65% of them were intended for Gore, he actually won the state by at least 60,000 votes.
According to the U.S.
Census, 125.7 million votes were cast in 2004. The recorded vote was 122.3m
and 3.4m were uncounted. The Census survey margin of
error is 0.30%. Therefore there is a 97.5% probability that at least 125
million cast votes. According to detailed information provided by investigative
reporter Greg
Palast, 3.006m votes cast were never counted. They were comprised of 1.389m
spoiled ballots, 1.091m provisional and .0.526m absentee. The 0.40 million
(0.31%) discrepancy between the Census and Palast matches the Census MoE.
First-time Voters
They claimed that the vaunted 2004 Republican GOTV
campaign brought Bush millions of new Christian fundamentalist votes. But
they failed to note that since 1992, according to the National Exit Poll, the
Democrats won first-time voters by a 14% average margin. Ruy Teixeira wrote
about it in The Emerging Democratic Majority. Furthermore, the Democrats had a remarkable
voter
registration and GOTV effort. In the strongest Democratic areas, the pace
of new registration was 60 percent higher than in 2000; it was just 12 percent
higher in Republican areas.
Undecided Voters
They rejected the evidence that late undecided voters
virtually always break for the challenger. But world-class pollsters Zogby and Harris,
who have a combined 60 years of experience, indicated that late polling
showed that Kerry won 67-75% of undecided voters. The National Exit
Poll also reported that Kerry won a clear majority of undecided voters. This
was not unusual; historical evidence indicates that undecided voters break for
the challenger over 80% of the time - especially when the incumbent is
unpopular. Bush had a 48.5% average approval rating on Election Day. The final
Zogby polls in nine battleground
states had Kerry leading by a 50-45% average. He was projected to win all
nine by 53-46% - but won only five by 50-49%. The margin of error
was exceeded in six of the nine states, a 1 in 52 million probability.
This is what the
Gallup poll said about undecided voters:
‘In the final USA
TODAY/CNN/GALLUP poll before the election, President Bush held a 49-47 edge
over Sen. John Kerry when the undecided voters were not allocated to a
particular candidate. When Gallup, using
a statistical model that assumes that 9 of 10 of those voters would support
Kerry, allocated the voters, the poll ended as a dead heat with each
candidate garnering 49%. The Gallup
allocation formula is based on analyses of previous presidential races
involving an incumbent’.
Bush Approval
Rating
They dismissed the significance of the Bush 48.5% approval rating on Election Day. But historically, incumbents with approval below 50% lost re-election (Ford, Carter, Bush I) while incumbents above 50% won (Eisenhower, Johnson, Nixon, Reagan, Clinton). The near-perfect 0.87 correlation between Bush’s monthly approval rating and average national poll is further evidence. The correlation was confirmed when Kerry won the 12:22am National Exit Poll by 51-48%. The Final Exit Poll forced a bogus 53% Bush approval weighting to in order to match the vote count.
Final 5 Million
Recorded Votes
They can’t explain these anomalies in the recorded state vote shares: 1) the strong correlation between the state exit polls and late vote shares (Kerry led in both), 2) the small discrepancies between the exit polls and the late vote shares, and 3) the consistent pattern of a higher Kerry share of late votes compared to his initial share. But it’s further evidence that the ‘pristine’ exit polls were close to the true vote. Bush won 51.0% of the initial 117.28m votes; Kerry won 53.0% of the final 5.0m. Kerry exceeded his initial vote share in 38 states, including 15 of 19 in the battleground. A false impression was created early that Bush was winning as the first reported votes came in from the East. But even as the recorded votes were being reported on TV, state and national exit polls showed that Kerry was winning the popular and electoral vote. The vote-rigging apparently ended before the final 5m were recorded; Bush had already ‘won’ the electoral vote and held a 3.5m lead in the popular vote. After the final 5m votes were recorded, his ‘mandate’ declined by 0.5m to the official total of 62.04-59.03m.
Weighted Average
State Vote shares
They claimed that Bush led in the pre-election state and national polls. But they forgot to calculate the national vote as a weighted average (based on the voting population) of the state poll shares. State polling data shows that Kerry led the weighted average from July to Election Day except for a brief period in September. Bush led the unweighted average. Kerry also led the national pre-election polls. In both poll sets, before undecided voter allocation, Kerry led by less than 1% nationally. But he led by 3% in the battleground states.
Vote Share
Projection and Electoral Vote Simulation
They disputed the fact that the Nov.1, 2004 Election Model projections were accurate and that the final pre-election polls matched the exit polls. But assuming that Kerry captured 67-75% of the undecided vote, the pre-election state (Kerry 47.9 - Bush 46.9%) and national polls (Kerry 47.2 - Bush 46.9%) closely matched the 12:22am Naational Exit Poll (50.8 -48.2%). The state and national models projected Kerry as the winner by 51-48%, matching the 12:22am NEP and the weighted average state exit polls (51.8-47.2%). The Monte Carlo Electoral Vote Simulation (5000 election trials) forecast that Kerry would win 320-337 electoral votes, assuming that he captured 60-75% of the undecided vote. Pollsters Harris, Zogby and the National Exit Poll said he won the undecided vote by 60-75%. The pre-election projections were also confirmed by the state and national exit polls in the Interactive Election Simulation Model.
Random-selection and
Margin of Error
They declared that exit polls were not true random samples. But Edison-Mitofsky state in the notes to the 2004 National Exit Poll that respondents were randomly-selected with a 1% overall margin of error. And the pre-election polls all provide a margin of error based on the number of respondents.
National Exit Poll
Timeline
They forgot about the Law of Large Numbers. Kerry led the National Exit Poll by 51-48% at 4pm (8349 respondents), 7:30pm (11027) and 12:22am (13047). But Bush won the 2pm Final NEP (13660) by 51-48% through the use of impossible weights and implausible vote shares which were required in order to match the recorded vote.
Matching Exit Polls
to the Recorded Vote
They dismissed the accuracy of the early exit polls. But it’s standard operating procedure that the final exit polls are always fixed to match the recorded vote even if it means using impossible weights and implausible vote shares. This implies that the recorded vote was fraud-free – not exactly a reality-based assumption. Preliminary state and national exit polls are ‘contaminated’ when they are forced to match a corrupt vote count.
Gender
They need to explain how Bush sharply increased his share of Democratic women voters while his share of Republican males declined. One would normally expect to see a positive correlation in the Demographic Trend between the two groups. But to believe that Bush won by the 62-59m recorded vote, one must believe that his ‘mandate’ was provided by women who in 2000 either a) did not vote, b) voted for Gore, or c) voted for Nader. According to the NEP, Kerry won new voters by 57-41%, Gore voters by 91-8% and Nader voters by 64-17%. So why should you believe it?
Exit Poll Bias
They noted a built-in Democratic bias in the exit polls. But they did not account for uncounted and switched votes. Exit polls overstate the recorded Democratic vote in every election. Part of the discrepancy is due to uncounted votes in heavily Democratic minority districts. In addition, solid documented evidence exists of direct vote-switching directly at DREs and on central tabulators where touch-screen, optical scanner, lever and punched card votes are counted. Republicans manufacture the voting machines which can easily be hacked.
Margin of Error and
the Cluster Effect
They said that the margin of error used in calculating the probabilities of the exit poll discrepancies was too low. But even assuming a 60% ‘cluster effect’, the probabilities were still near zero. The WPE-adjusted state exit polls discrepancies, even assuming a 30% cluster effect, exceeded the margin of error in 24 states for Bush. The Composite (12:22am) discrepancies exceeded the margin of error in 16 states - all in favor of Bush. Not a single state deviated beyond the MoE for Kerry. Assuming a zero cluster effect, the probability that the MoE would be exceeded in 16 states by Bush is 1 in 19 trillion. A probability sensitivity analysis gave Kerry a 98% probability of winning a popular vote majority - even assuming a 50% cluster effect.
Urban Legend
They can’t explain The Urban Legend myth: How did Bush gain vote share in heavily Democratic urban locations, yet lose share in highly Republican small towns and rural areas? An analysis of the 2000 and 2004 NEP location-size demographic shows a 9% increase in the Bush share of the heavily Democratic urban vote and a 3% decline in share of the heavily Republican small town and rural voter. And how did he manage a 3% increase in the suburbs which has been trending Democratic in recent elections?
Regions and Time
Zones
They cite Bush voter non-response and Gore voter false recall as reasons why the margin of error was exceeded (using the average state WPE) in 29 states for Bush and in just one for Kerry. All 21 Eastern Time Zone states red-shifted to Bush and 14 exceeded the MoE. But the probability that the exit poll margin of error would be exceeded in 29 states is ZERO.
Red-shift vs.
Blue-shift
They overlooked the fact that 41 states switched to Bush from the final pre-election polls to the recorded vote. But none of the 10 states which switched to Kerry was a battleground state. Forty-three states red-shifted to Bush from the 12:22am exit polls. Oregon was the only battleground state which shifted to Kerry – by less than one percent. It’s also the only state in which voting is done by mail. Was this all just a coincidence, a case of bad polling or an indication that fraud occurred?
They neglected to ask why six of the eight states which deviated to Kerry from the exit polls were strong Bush states: TN (1.63), TX (1.65), SD (1.67), ND (2.51), KS (2.37) and MT (0.22). The exit poll discrepancies (shown in parenthesis) were all within the exit poll margin of error. But only two competitive states deviated to Kerry: OR (0.75) and HI (1.25). Is it just a coincidence that Oregon is the only state which votes exclusively by mail (100% paper ballots), and that any discrepancy in that state would be small and could favor either Bush or Kerry? And is it just a coincidence that Hawaii was not exactly a critical state?
They agreed that the vote-rich battleground states would decide the election. But was it just a coincidence that six deep-red states deviated to Kerry and not a single blue state? Or was it because Bushco did not want to explain a 50-state red-shift? Did they disregard the six states knowing that Kerry would not come close to winning them? Instead they focused on thwarting a nationwide blue-shift in competitive states. The beast was in the East, the rest were in the West.
Voter Mortality
They suggested that up to one million more Gore 2000 voters died than Bush voters had a major impact on the Bush ‘mandate’. They cited Gore’s 51-47% advantage in the Final NEP for the 60+ age group and calculated a 1.15% annual voter mortality rate (4.60% over the four years between elections). Therefore, approximately 5m of the 110.8m who cast votes in 2000 died prior to Nov 2004. But Gore’s 51% share of 5m is 2.55m; the Bush 47% share is 2.35m; the 0.20m difference is inconsequential. The Election Calculator showed Kerry winning by 10m votes with 53.5% of the popular vote.
Party ID
They need to explain why the Party ID mix changed from a 3-5% Democratic edge over the last 4 elections to an even 37/37 split in the Final National Exit poll. The 12:22am NEP update had a Party ID mix of 38% Democrats, 35% Republicans and 27% Independents; corresponding Kerry vote shares were 91%, 7% and 52%. In the Final NEP (which was forced to match the recorded vote) the mix was changed to 37/37/26 with Kerry vote shares of 89%, 6% and 49%, respectively. The adjustments turned Kerry’s 51-48% win into a 51-48% loss. But the changes to the weights and vote shares left footprints which exposed the fraud. A Pew study shows that the Democrats have held a steady 4-5 point Party ID advantage in the four presidential elections since 1992. And the 1992-2004 Final National Exit polls indicate that the Democratic candidate won first-time voters by an average 14% margin. It’s only logical to conclude that a solid majority of first-timers were Democrats. So why should we believe the net 3% red-shift in weights in the Final NEP?
Reluctant Bush
Responders
They hypothesized that Bush voters were reluctant to respond to exit pollsters. But the rBr theory was contradicted by the 2004 Final Exit Poll. In the Final, Bush 2000 voters comprised 43% of the respondents, compared to 37% for Gore voters. And rBr was also contradicted by a linear regression analysis: exit poll non-response rates increased going from the strongest Bush states to the strongest Kerry states, which suggests that non-responders were Kerry voters. So they had to come up with another explanation. It was a perfect Hobson’s choice. If they believed the final Exit Poll (which Bush won by 51-48%), they would have to accept the weights which indicated that Bush voters were over-represented. But then they could not claim the rBr theory.
Mathematically
Impossible Voted 2000 Weights
They claimed that it was standard operating procedure to re-weight the exit polls based on the recorded vote. But the Final NEP ‘Voted in 2000’ weights (Bush 43/Gore 37%) were mathematically impossible. Bush 2000 voters could not have comprised 43% of the 122.3mm votes recorded in 2004, since 43% of 122.3 is 52.6mm and Bush only had 50.5mm votes in 2000. The 43/37 weights were irrelevant and misleading since they were mathematically impossible. Furthermore, since approximately 1.8mm Bush 2000 voters died prior to the 2004 election, the maximum number who could have voted in 2004 was 48.7 million, even assuming an impossible 100% turnout. This physical, incontrovertible mathematical fact totally confounded the naysayers. And the longer they tried to refute the facts, the sillier they looked.
The Democratic
Underground ‘Game’
They finally agreed in the Democratic Underground Game thread that the Final NEP Bush/Gore weights were impossible and came up with a new set of feasible weights. But they had to compensate for the change to feasible weights in order to match the recorded vote by inflating the Bush vote shares to implausible levels. This was necessary even though the shares were previously inflated in the Final with impossible weights in order to match the recorded vote. It was a feeble, last-ditch Hail Mary pass to justify the Bush ‘mandate’. They had to deal with an inconvenient truth: the Final National Exit Poll inflated the Bush tally by more than 4 million votes. But even though the weights were mathematically impossible, the exit-pollsters had no choice but to use them hoping that no one would notice. And so they lost the ‘Game’. Their use of implausible vote shares meant that they could not come up with one believable Bush win scenario.
To match the recorded vote, they were forced to make the following implausible assumptions:
1) 14.6% of Gore 2000 voters defected to Bush.
The 12:22am NEP reported that 8% defected; it was changed to 10% in the 2pm Final.
The probability of a 6.6% discrepancy is ZERO.
2) Kerry won 52.9% of those who did not vote (DNV) in 2000.
The NEP reported a 57-41%
spread; it was changed to 54-45% in the Final.
3) 7.2% of Bush 2000 voters defected to Kerry.
The NEP reported that 10% defected; it was changed to 9% in the Final.
False Recall
They knew that every theory they had proposed to explain the exit poll discrepancies was refuted. So they were forced to suggest ‘false recall’ as a last-ditch explanation and cited a post-election NES 600-sample survey to account for the impossible Final 43/37% Bush/Gore weights. This was the basis for their claim that 14.6% of Gore 2000 voters defected to Bush in 2004. They implied that approximately 6.6% of Gore 2000 voters (8.6% higher than the 12:22am NEP defection rate) misrepresented their vote and told the exit pollsters they voted for Bush in 2000. The reason: a long-term bandwagon effect: Gore voters wanted to associate with the ‘winner’.
But ‘false recall’ is not a plausible explanation since a) Gore won by 540,000 votes, b) according to the pristine 12:22am NEP, Kerry captured 91% of Gore voters and 10% of Bush voters, c) Bush had a 48.5% approval rating on Election Day 2004, d) false recall is not applicable to pre-election polls and e) the pre-election polls matched the exit polls. Why would Gore voters want to be associated with Bush? Even if returning Gore voters lied about their vote in 2000, it’s irrelevant. What is relevant is a) their factual 2000 recorded Gore vote and b) that 91% said they just voted for Kerry. We use this factual data to compute feasible and plausible weights by adjusting the 2000 recorded vote for mortality and estimated 2004 turnout.
They also need to explain how the ‘false recall’ hypothesis applies to other demographics. In the 12:22am NEP, 13047respondents were asked who they just voted for: Kerry won the Gender demographic by 50.78-48.22%. But only 3200 of the 13047 respondents were asked how they voted in 2000. But Kerry won the other 10,000 respondents (who were not asked who they voted for) by 51-48%. This totally contradicts the ‘false recall’ argument. Why would 10,000 respondents tell the exit pollsters that they just voted for Kerry if they wanted to be associated with Bush?
Feasible Weights
and Plausible Vote shares
They maintain that the base case assumptions in the True Vote Model are not feasible and plausible. But the assumptions were based on feasible weights applied to plausible 12:22am NEP vote shares. The model determined that Kerry won by 66.1 - 58.4mm (52.6 - 46.4%). Applying the weights to the 2pm Final NEP (which used inflated Bush vote shares to match the vote count) Kerry was still the winner by 3.4 million (51.2 - 48.4%). The True Vote Model input consists of the following: 1) feasible ‘Voted 2000’ weights (ratio of Kerry, Bush, Nader/other and new voters). The 2000 recorded vote was reduced by 3.5% for mortality and 95% turnout of 2000 voters in 2004; 2) 12:22am NEP vote shares; 3) 3.4mm uncounted votes: 125.7mm reported by the 2004 Census Bureau less 122.3mm recorded; 4) 2.6mm (75%) of the uncounted votes were for Kerry; historically, the majority of uncounted votes have been in Democratic minority districts.
Switched Votes
The True Vote model also determined that 4.5m (6.8%) of Kerry’s true vote must have been switched to Bush. The simple formula is True Vote = Recorded + Uncounted + Switched. Kerry’s True Vote was 66.1m, his recorded vote 59.0m and 2.6m were uncounted. The model also concluded that Kerry won 336 electoral votes. This result matched the Nov.1 Election Model which used Monte Carlo Simulation to calculate Kerry’s expected electoral vote.
The Election Incident Reporting System (EIRS)
According to the 2004 EIRS, 86 of 88 touch screen vote switching incidents were from Kerry to Bush, a 1 in 79 sextillion probability.
Sixteen Million New
Bush Voters
They failed to explain how Bush found 16m new voters (DNV2k) to reach 62m in 2004. He had 50.5m votes in 2000. But only 46m returned to vote in 2004. Approximately 2m Bush voters died and an estimated 2.5m did not vote, assuming a 95% turnout. According to the 12:22am National Exit Poll, Bush won 41% of 26.3m new voters. The 19% discrepancy was 11 times the 1.72% margin of error. The probability of the discrepancy is ZERO. It’s important to note that a solid majority of new voters were Democrats and Independents who gave Bush an approval rating much lower than his total 48.5% average on Election Day 2004.
They need to explain how Kerry lost the popular vote in 2004, even though he won a solid 57-41% share of new (DNV2k) voters. Of the DNV2k voters, Kerry won first-time voters by 55-43% and other new voters by 61-37%. Gore won the popular vote in 2000 even though Bush captured new (DNV96) voters by 52-44%. But this is quite strange, especially since Gore won first-timers (52-43%) and Bush won others (71-26%). How could there have been such a wide discrepancy in vote share between first-timers and others? Did Bush really win 71% of other new voters?
2000 Voter Turnout
They belittled a comprehensive sensitivity analysis which indicated that Kerry won all plausible scenarios of voter turnout and new voter share. But assuming 12:22am NEP vote shares and 100% Bush 2000 voter turnout, Gore voter turnout had to be 73% for Bush to tie Kerry and 64% to match the recorded 62-59mm vote.
Implausible Vote Shares
They need to explain these implausible changes in Bush NEP vote shares from 2000 to 2004:
-The Bush share of females increased by 4.2% while his share of males decreased by 0.2%
-His share of white females increased by 5.0% while his share of white males decreased by 0.9%
-His share of non-white females increased by 4.0% while his share of non-white males increased by only 0.76%
-His share of female independents increased by 1.8% while his share of male independents decreased by 5.6%
Didn’t females vote 54-45% for Kerry? Didn’t over 90% of blacks vote for him? Weren’t independents for Kerry by 52-44%? Why would independent males defect to Kerry at triple the rate that independent females defected to Bush? Didn’t Nader voters break 3-1 for Kerry?
Swing vs. Red-shift
They claimed that the raw exit poll data which have not been made public indicates that there was no tendency for Bush to do better in 2004 relative to 2000 (‘swing’) than he did in the 2004 exit poll (‘red-shift’). They presented their analysis in a swing vs. red-shift scatter chart and concluded from the flat regression line that the exit poll discrepancies did not indicate fraud. But they did not consider the following factors: According to the 2004 National Exit Poll, Kerry won 71% of returning Nader voters compared to 21% for Bush. A similar split would have increased Gore’s margin by 1.4mm. Assuming that 75% of approximately 5 million uncounted votes were for Gore, his margin increases by another 2.5 million. When added to his recorded 540,000 vote margin, Gore’s adjusted margin becomes 4.5 million. And that does not consider the effects of vote-switching. We know a lot more about vote-switching than we did in 2000. It’s very likely that Gore votes were switched to Bush. But assuming zero vote-switching, Gore’s adjusted, true margin was close to 4.5 million: 2.5m uncounted + 1.4m Nader + 0.54m recorded. They never normalized the 2-party state vote shares in calculating ‘swing’. Actual adjusted swing was 3.9%, recorded swing 2.0%; red-shift 4.1%. An adjusted swing vs. red-shift bar graph displays the deviations. Another scatter chart shows that adjusted swing exceeded 4% in 18 states while red-shift exceeded 4% in only 4 states. The naysayer swing vs. red-shift argument is just another ruse meant to divert, confuse and mislead.
Ohio
They argued that the Final Ohio exit poll does not indicate fraud. But they ignored the massive documented evidence of uncounted and switched votes, apart from voter disenfranchisement. And two election workers were convicted of rigging the recount. Kerry won the 12:22am Ohio exit poll Gender demographic (1963 respondents) by 52.06-47.94% and the WPE-adjusted exit poll by 54.2-45.4%. But he lost the 2:06pm Final (2020 respondents) by 50.94-49.06%. In the Final, vote shares and weights were changed in favor of Bush to match the miscounted Ohio recorded vote. This was just like the final 2pm NEP in which vote shares and weights were changed from the 12:22am update in order to match the miscounted National vote. Two models confirmed that Kerry won Ohio. The first was based on 12:22am NEP vote shares with weights adjusted to the Ohio 2000 recorded vote. Kerry was the 51.74-48.26% winner, within 0.32% of the exit poll. The second was based on uncounted (3%) and switched vote (6.15%) assumptions applied to the recorded vote. Kerry was the 52.6-47.4% winner. An exhaustive statistical study of actual ballots in Ohio’s Cuyahoga County (Cleveland) indicated that 6.15% of Kerry’s votes were switched.
Using the original 12:22am Ohio exit poll weights for the following demographics, it would have been necessary to inflate the Bush vote shares to implausible levels to match the recorded vote. So the weights were adjusted in favor of Bush to minimize the change:
First-time voters
Of the 14% who were first-time voters, 55% were for Kerry. Are we to believe that he won just 47% of the other 86%?
When Decided
Of the 21% who decided in the month prior to the election, 62% voted for Kerry. Are we to believe that he won just 45% of the 79% who decided earlier? Did Bush lead by 10% in any of the early polls?
Party ID
The weights changed from 38D/35R to 35D/40R, a 7.9% shift. With the original weights, Bush needed 17% of Democrats to match the recorded vote. He had 8%.
Ideology:
Liberal/Conservative weights changed from 21/32 to 19/34, a 9.5% shift. With the original weights, Bush needed 23% of Liberals to match the recorded vote. He had 13%.
Voted for Senate
Democratic/Republican weights changed from 43/57 to 36/64, a 16.3% shift. With the original weights, Bush needed 14% of those who voted for the Democratic candidate. He had 7%.
Florida
They ignored Florida’s implausible vote count by machine type and party registration. In 2000, Bush supposedly ‘won’ by 547 official votes. Given Gore’s 70% share of 180,000 uncounted under/over votes, Gore won by at least 60,000 votes. In 2004, Bush supposedly ‘won’ by 52-47%, a 368,000 vote margin. The final Zogby pre-election poll had Kerry winning by 50-47%. Kerry led the WPE-adjusted exit poll by 50.9-48.3%.
Dan Rather’s voting machine expose showed that poor-quality paper used in punch card machines was a major cause of election fraud in heavily Democratic precincts, thus illustrating a previously unknown method used to hack mechanical voting machines, whether punch card or lever.
The Democrats had a 41- 37% registration advantage in Touch Screen (TS) counties and a 42-39% edge in Optical Scan (OS) counties. Kerry won the TS counties (3.86mm votes) by 51-47%, but Bush won the OS counties (3.43mm votes) by a whopping 57-42%. Kerry’s low vote shares in the three most heavily populated (and Democratic) TS counties (Palm Beach, Broward, Dade) are highly suspect. Florida voter registration by party is the same in TS and OS counties, so we aren’t comparing apples and oranges. The TS county vote share matched the 12:22am NEP to within 0.43% for Bush and 0.31% for Kerry. The OS county share deviated by 9.0% for Bush (307,000 votes) while the Kerry discrepancy was -8.1% (278,000).
Several models indicate that Kerry won Florida. The first was based on voting machine type (optical scanners and touch screens) and used 2004 NEP ‘Party ID’ vote shares with party registration percentage weights. Kerry won by 50.7-47.7% (closely matching the exit poll) - a 221,000 vote margin. The second was based on uncounted (1%) and switched vote (6.9%) assumptions applied to the 2004 recorded vote. Kerry won by an identical 221,000 votes. In a third calculation based on 12:22am NEP vote shares with weights adjusted based on the Florida 2000 recorded vote, Kerry was a 52.6-46.7% winner. In a fourth calculation, based on uncounted (3%) and switched vote (7%) assumptions applied to the recorded vote, Kerry was a 51.3-48.2% winner. Assuming that Kerry won 70,000 of 96,000 Nader 2000 votes (based on his 71% NEP share), he had a built-in 100,000 vote advantage on Election Day … assuming all the votes would be counted. Given a 1.0% margin of error, the probability is 1 in 12.7 trillion that Kerry’s total TS county vote share would exceed his total Florida share by 4.2%.
New York
They cherry-picked the final NY pre-election poll in a feeble attempt to prove that the pre-election polls didn’t match the exits. Kerry won the final NY pre-election poll by 59-40%. The recorded vote was 58.5-40.2%. But they cannot explain how Kerry won 66% of the final 497,000 votes recorded. They claimed that the NY pre-election poll was correct and that the WPE-adjusted exit poll (Kerry 64.1- Bush 34.4- Other 1.5) was wrong. The Exit Poll MoE is 2.6% for 1452 respondents (3.2% if a 30% cluster effect is assumed).
They claimed that the NY pre-election poll matched an accurate recorded vote. Their proof: Lever voting machines have a low 1% spoilage rate. But they cannot provide evidence that ALL the votes were counted accurately in ALL the precincts and they failed to consider absentee and provisional ballots. Historical evidence indicates that Lever machines are vulnerable to rigging. Dan Rather’s voting machine expose was a clear example. In Florida 2000, poor-quality paper used in punch card machines was a major cause of election fraud in heavily Democratic precincts, thus illustrating a previously unknown method used to hack mechanical voting machines, whether punch card or lever.
There are four fundamental flaws in their argument.
They failed to consider the NY 2000 vote: Gore 60.2 - Bush 35.2 - Nader 3.6. Their argument implies that the 2004 recorded vote was fraud-free and that 100% of returning Nader 2000 voters defected to Bush - clearly an impossible scenario. In fact, according to the 12:22am NEP, Kerry won Nader voters by 71-21% and 10% of Bush voters defected to Kerry while just 8% of Gore voters defected to Bush. Adjusting the NEP weights based on the NY 2000 recorded vote and assuming 12:22am NEP vote shares, Kerry won by 63.6-35.1%.
They ignored the theoretical margin of error. It’s well-known that exit polls are more accurate than pre-election polls. There was a 5.1% discrepancy between Kerry’s NY pre-election (59%) and exit poll (64.1%). Since the MoE is 4% for a typical 600-sample pre-election state poll, there was a 95% probability that Kerry’s True vote was in the 55-63% range. The NY exit poll 3.2% MoE (30% cluster effect) implies there was a 95% chance that Kerry’s True vote was in the 60.8-67.2% range which would fall within the MoE of both the NY pre-election and exit poll. On the other hand, the weighted average of 51 state pre-election polls (adjusted for undecided voters) matched the National Exit Poll to within 1%. Once again, it’s the Law of Large Numbers taking effect.
They failed to consider that Kerry’s vote share was 10% higher in NY than nationally. The Election Calculator, which accounts for voter mortality, turnout and uncounted votes, determined that Kerry won by 64.0-34.5%. The assumptions were as follows: Gore and Kerry won 75% of the uncounted votes (5% of total cast); Kerry won 94% of Gore voters, 12% of Bush voters, 61% of new (DNV2k) voters and 68% of returning Nader/other voters. A sensitivity analysis shows that if Kerry won 90-98% of returning Gore voters and 57-65% of DNV2k, his NY vote share ranged from 61.3 to 66.7%.
They implied there was zero fraud in claiming that the recorded vote was the true vote. An analysis of the effects of uncounted and switched votes indicates that Kerry won by 63-36%. If 2% of total votes cast were uncounted (75% to Kerry), then 7% of Kerry votes were switched to Bush. The uncounted vote assumption is lower than the 2.74% national average (NY uses lever voting machines).
Exit Poll Response
Optimization
Four independent mathematical methods applied to three distinct sets of precinct, national and location-size exit poll data each produced the identical result. The USCV simulation; 1250 precincts by partisanship; location-size; NEP Voted in 2000 were in near-perfect confirmation.
The Exit Poll Optimizer employed the Excel Solver algorithm to obtain a feasible solution for the 2-party vote (Kerry 52.15-Bush 47.85%). The data constraints included the recorded vote (Bush 51.24-Kerry 48.76%), response rates and within precinct error (WPE) categorized into five partisanship groupings: Strong Bush, Bush, Even, Kerry, Strong Kerry.
The Optimizer confirmed the USCV simulation. Both models analyzed summary exit poll data for 1250 precincts supplied by Edison-Mitofsky and in so doing, debunked the reluctant Bush responder (rBr) hypothesis. The Optimizer also exactly matched the 12:22am National Exit Poll ‘Voted in 2000’ demographic two-party result: Kerry 52.15- Bush 47.85%. The identical result was obtained by running the Optimizer for five NEP location-size category groupings (Big Cities, Small Cities, Suburban, Small Towns and Rural, given the WPE for each category.
The 2006 Midterms:
Tsunami Denied
Except for the notorious 2006 FL-13 congressional race in
which 18,000 mostly Democratic votes were mysteriously missing, the evidence of
massive fraud in the midterm elections is hardly mentioned in the corporate
media.. The fraud probably cost the Democrats 10-20 congressional seats.
The 2006 National Exit Poll ‘How Voted in 2004’ weights were changed from 47 Bush / 45 Kerry at 7pm on Election Day to 49/43 in the Final NEP at 1pm on the following day. Once again, just like in 2004, the exit pollsters had to match the vote count by expanding the weight spread from 2% to 6%! This had a major effect in cutting the Democratic margin in half - from 55-43% to 52-46%. As noted earlier, the 2004 12:22am NEP ‘How Voted in 2000’ Bush/Gore 41/39 weights were changed to 43/37 in the 2pm Final, turning a 51-48% Kerry victory into a 51-48% loss.
If plausible 49 Kerry/ 46 Bush weights (based on
the 2004 NEP) are used, the TRUE Democratic margin becomes 56.7-42.1%, exactly
matching the 120 pre-election Generic
Poll trend line. Was this just a coincidence or another confirmation
that the pre-election polls matched the 7pm National Exit Poll? You decide.
This is an
extensive report of e-voting failures from votersunite.org.
This Pew 2006 Election Analysis of voting ‘glitches’, ‘snafus’ and ‘hiccups’ describes the chaos state by state.
This Survey of
Pollworker and Voter Experience Reveals Pervasive and Recurrent Failures among
Computerized Voting Systems.
An extensive analysis of ballots cast in the Ohio 2006 Senate Race by Richard Hayes Phillips, Ph.D. proved that the recorded vote count was impossible
_______________________________________________________________________________________________________________
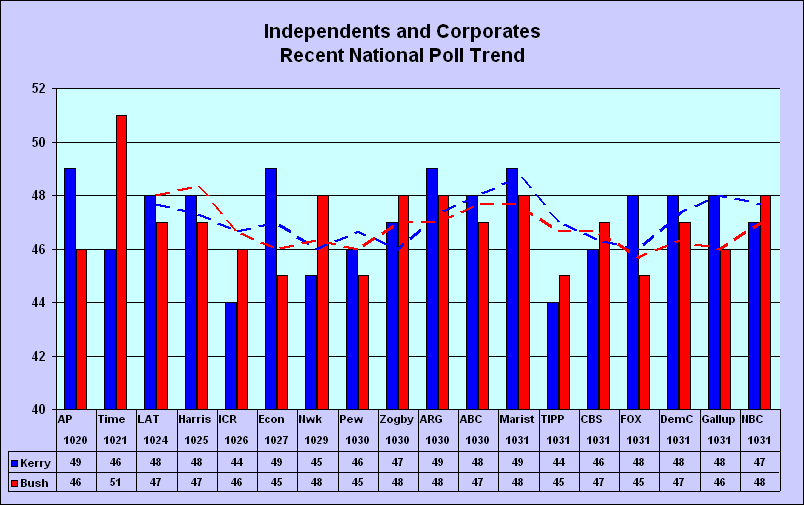
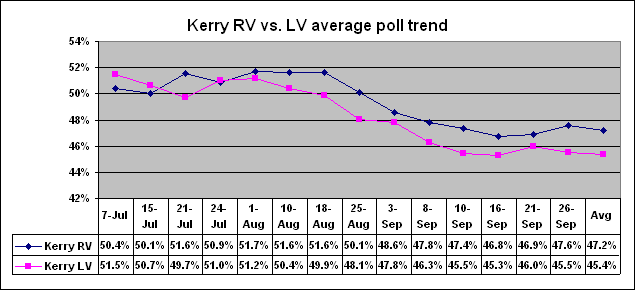
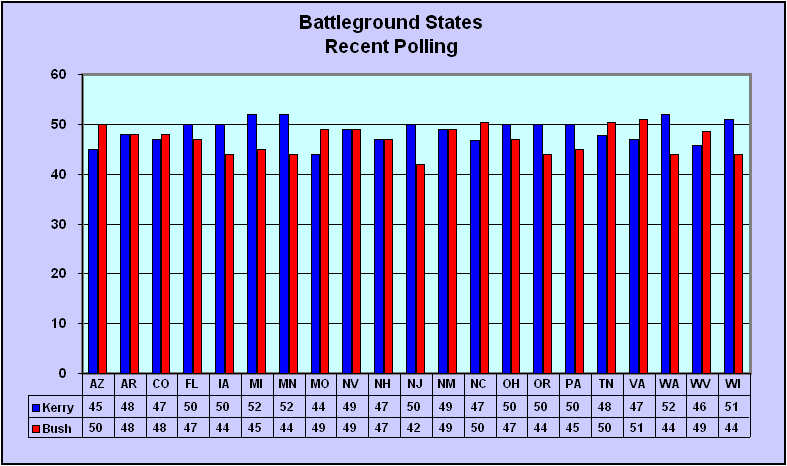
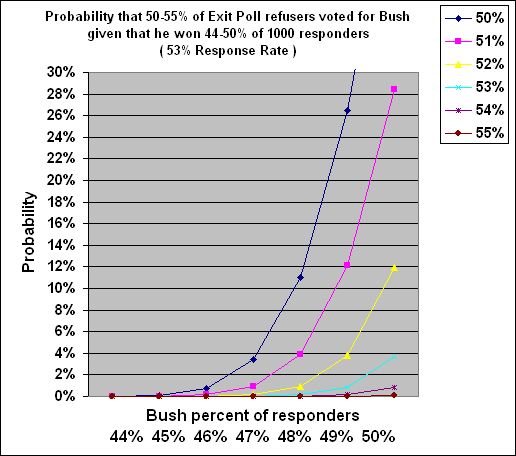
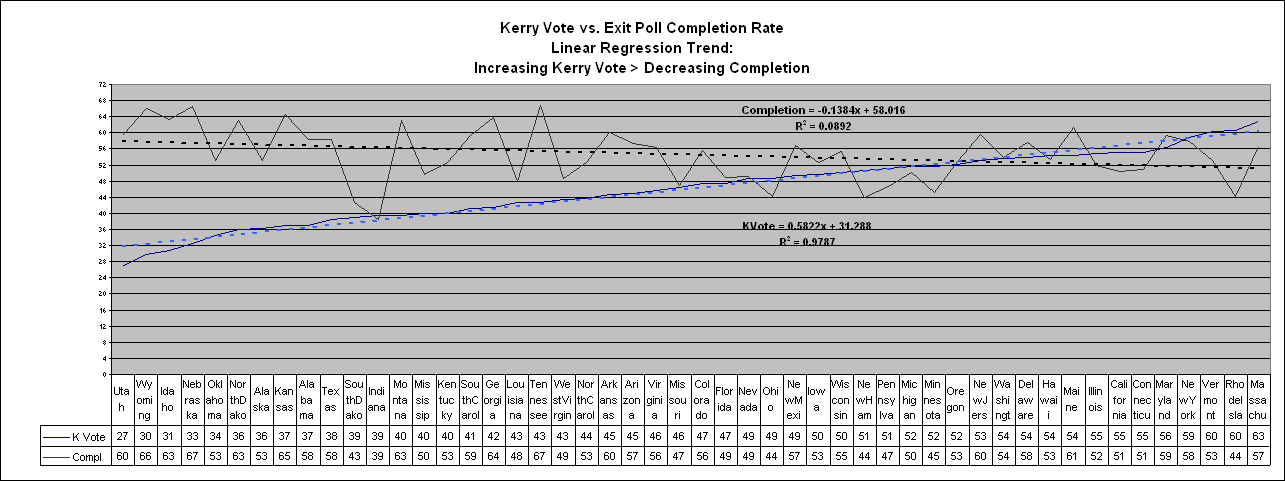
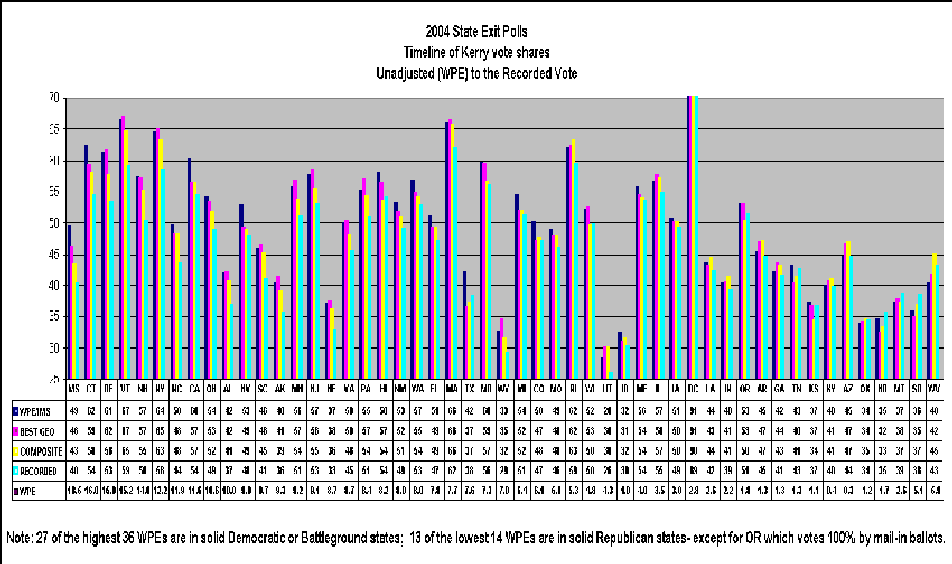
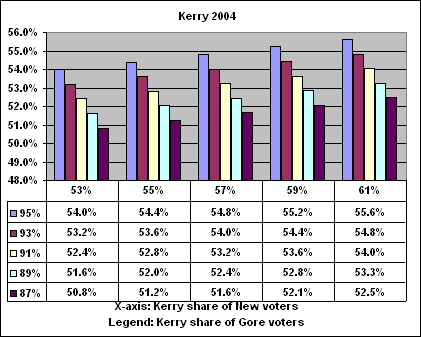
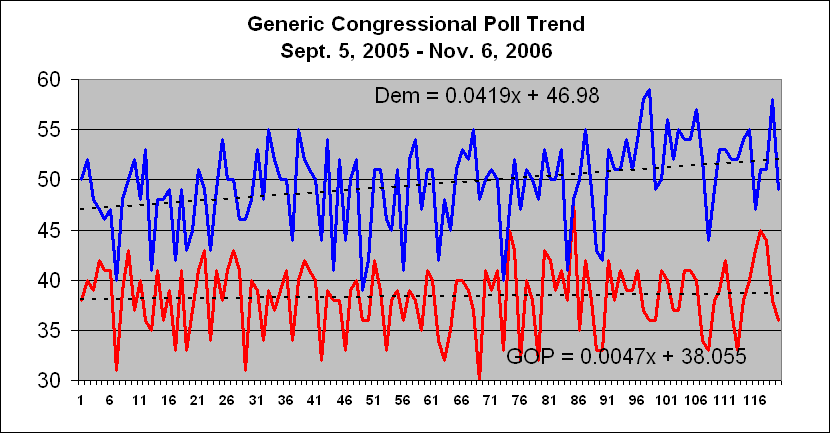
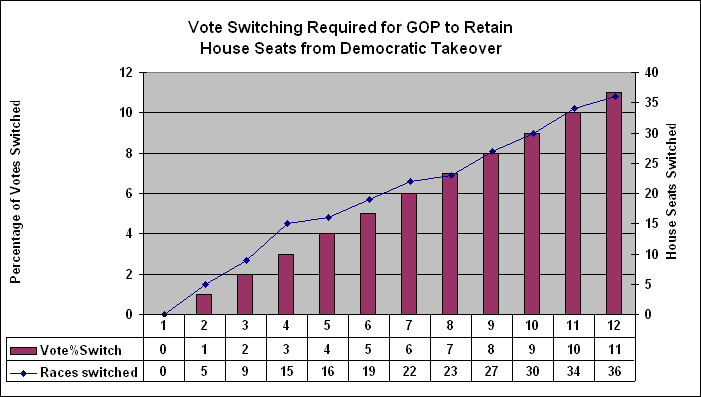