Election Fraud Lockdown: No Discussion by Politicians,
Forecasters and Media Pundits
Inherent flaws exist in all election models. The implicit forecast assumption is that the official recorded vote will accurately reflect the True Vote; the election will be fraud-free. But fraud has been a major factor since 1988. Forecasters who predicted Bush would win in 2000 and 2004 were only “correct” because of a rigged recorded vote. Kerry won the True Vote.
Prominent election forecasters discuss their methodologies in
a special issue of the International Journal of Forecasting published this
month. The articles range from descriptions of diverse election forecasting
models, such as those that use political futures markets and historical
analysis, to those which evaluate the success of election forecasting in past
elections. But none mention the subject
of historical election fraud. Are they that clueless? Or are they afraid of
jeopardizing their positions by daring to suggest that our “democracy” is a
myth?
Consider this statement from the American Association of Public Opinion Research (AAPOR): “What is important to note is that at the close of Election Day, exit poll results are weighted to reflect the actual election outcomes. It is in this way that the final exit poll data can be used for its primary and most important purpose – to shed light on why the election turned out the way it did. That is, exit polls are just as important for the information they gather about the voters’ demographics and attitudinal predispositions towards the candidates and the campaign issues as they are for making the projections reported by news organizations on Election Night”.
So the purpose of the
final exit poll is to get accurate demographic data by matching to the actual
vote count. Is this the way to conduct statistical research? What if the vote count is corrupted?
Uncounted votes have steadily declined as percent of total votes cast - from 10.4% in 1988 to 2.7% in 2004. When added to the recorded vote in order to derive the total votes cast for the five elections from 1988-2004, the average Democratic unadjusted exit poll share is within 0.1% of the adjusted vote. The 2004 exit poll discrepancies were different in kind and scope from those of the prior four elections. Unlike 1988-2000, the 2004 discrepancies cannot be explained by uncounted votes alone.
The 2004 Election Calculator Model is based on the physical
constraints of the 2000 recorded vote, after adjusting for mortality, uncounted
votes and 2000 voter turnout in 2004. Vote shares are based on the 2004 National
Exit Poll “Voted 2000” cross tab. The model indicates that Kerry won by
53.2-45.4% (66.9-57.1m). It proves that for Bush to obtain his 3.0m
margin in 2004, he would have required 21.5% of returning Gore voters!
This article will discuss the following topics:
. Election 2004 Forecast Models: The Track Record
. The American Association of Public Opinion Research (AAPOR)
. Uncounted Votes and Exit Poll Discrepancies (1988-2004)
. Projection and Post-election Models:
. Implausible: Returning Gore voters required for Bush’s 3.0m margin in 2004
_____________________________________________________________________________________
Election 2004 Forecast Models: The Track Record
The following election forecast models were executed 2-9 months before the 2004
election. All except one forecast that Bush would win the 2-party popular vote
with an average 53.9% share which was 3% above the actual recorded vote. But according to the aggregate unadjusted state exit
polls, Bush had 47.5%. Furthermore, except for Beck-Tien,
the estimated popular vote win probabilities were incompatible with the
forecast vote shares (they were too low). And
none of the models attempted to forecast the electoral vote or even mentioned
the possibility of election fraud.
Author Date
Pick 2-pty Win Prob
Recorded 2-Nov
Bush 51.2 Final
Beck-Tien 27-Aug Kerry 50.1 50
Abramowitz 31-Jul
Bush 53.7 -
Wlezien 27-Jul Bush 52.9 75
Holbrook 30-Aug
Bush 54.5 92
Lockabie 21-May Bush 57.6 92
Norpoth 29-Jan
Bush 54.7 95
Compare the above projections
to these pre-election poll and exit poll-based models.
TruthIsAll Election Model (
Assumption: Kerry wins 75% of
undecided voters
State
Kerry 51.8 99.9
National
Kerry 51.6 94.5
Final 5 national polls average projection (2% MoE)
Exit Polls (2% MoE)
State
Aggregate Kerry 52.5 99.1 Unadjusted WPE method
NEP 1
Kerry 51.9 96.9 Voted
2k,
NEP
2 Kerry 52.9 99.8
Voted 2k,
Election Calculator
True Vote Model
(TruthIsAll) Kerry 53.7 99.99 12:22am NEP, 125.7m votes cast; 1.22% annual 2000
voter mortality, 95% 2k voter turnout
The following article from two professors of political
science describes the methodologies used by a number of 2008 election
forecasters. None of the assembled articles discusses the historical
evidence of election fraud or its likely impact on their forecasts for 2008.
Election
Forecasters Preparing for Historic Election
Science Daily (June 23, 2008) — Anticipating what is likely to be one of the most interesting elections in modern history, University at Buffalo professor of political science James E. Campbell and Michael S. Lewis-Beck, professor of political science at the University of Iowa, have assembled the insights of prominent election forecasters in a special issue of the International Journal of Forecasting published this month.
Each of the articles demonstrates the challenges of election
forecasting, according to Campbell, chair of UB's Department
of Political Science, who since 1992 has produced a trial-heat-and-economy
forecast of the
The articles range from descriptions of diverse election forecasting models, such as those that use political futures markets and historical analysis, to articles that evaluate the success of election forecasting in past elections. Two of the articles address a topic particularly pertinent to the 2008 presidential election: whether open seat and incumbent elections should be treated differently by election forecasters.
"One of the biggest misunderstandings about election
forecasting is the idea that accurate forecasts must assume that the campaign
does not matter,"
Though some campaign effects are unpredictable "the
extent of these effects is usually limited,"
Of the six different forecast models described in the journal articles, only two have a forecast at this point. The other four will have forecasts between late July and Labor Day. The journal articles can be downloaded at sciencedirect.com. Below are brief descriptions:
In "U.S. Presidential Election Forecasting: An Introduction" journal co-editors Campbell and Lewis-Beck provide a brief history of the development of the election forecasting field and an overview of the articles in this special issue.
In "Forecasting the Presidential Primary Vote:
Viability, Ideology and Momentum," Wayne P. Steger of
In "It's About Time: Forecasting the 2008 Presidential Election with the Time-for-Change Model," Alan I. Abramowitz of Emory University updates his referenda theory-based "time for a change" election forecasting model first published in 1988. Specifically, his model forecasts the two-party division of the national popular vote for the in-party candidate based on presidential approval in June, economic growth in the first half of the election year, and whether the president's party is seeking more than a second consecutive term in office.
In "The Economy and the Presidential Vote: What the Leading Indicators Reveal Well in Advance," Robert S. Erikson of Columbia University and Christopher Wlezien of Temple University ask what is the preferred economic measure in election forecasting and what is the optimal time before the election to issue a forecast.
In "Forecasting Presidential Elections: When to Change
the Model?" Michael S. Lewis-Beck of the
In "Forecasting Non-Incumbent Presidential Elections: Lessons Learned from the 2000 Election," Andrew H. Sidman, Maxwell Mak, and Matthew J. Lebo of Stony Brook University use a Bayesian Model Averaging approach to the question of whether economic influences have a muted impact on elections without an incumbent as a candidate. The Sidman team concludes that a discount of economic influences actually weakens general forecasting performance.
In "Evaluating U.S. Presidential Election Forecasts and
Forecasting Equations," UB's
In "Campaign Trial Heats as Election Forecasts:
Measurement Error and Bias in 2004 Presidential Campaign Polls," Mark
Pickup of
In "Prediction Market Accuracy in the Long Run,"
Joyce E. Berg, Forrest D. Nelson, and Thomas A. Reitz from the
In "The Keys to the White House: An Index Forecast for
2008," Allan J. Lichtman of
In "The State of Presidential Election Forecasting: The
2004 Experience," Randall J. Jones, Jr. reviews the accuracy of all of the
major approaches used in forecasting the 2004 presidential election. In
addition to examining campaign polls, trading markets, and regression models,
he examines the records of
_____________________________________________________________________________________
The American Association of Public Opinion Research
(AAPOR)
This paragraph from the article says it all:
“What is important to note is that at the close of Election Day, exit poll results are weighted to reflect the actual election outcomes. It is in this way that the final exit poll data can be used for its primary and most important purpose – to shed light on why the election turned out the way it did. That is, exit polls are just as important for the information they gather about the voters’ demographics and attitudinal predispositions towards the candidates and the campaign issues as they are for making the projections reported by news organizations on Election Night”.
The purpose of the Final
exit poll is to get accurate demographic data by matching to the actual vote
count? Is this the way to conduct statistical research? What if the vote count
is fraudulent? What is their Null Hypothesis? AAPOR refers to challenges
facing exit pollsters, but they ignore
the challenge of calculating the impact of election fraud on the recorded vote.
If the vote counts were accurate, the demographics would be
correct. Since the recorded vote counts are bogus, so are the demographics.
Assuming that the vote count is pristine is to immediately invalidate the
demographics on which it is based. It's a very simple concept if you really
want to do the best analysis possible to get at the truth: It's Basic
Statistics 101. We need to analyze the
raw, pristine, unadjusted exit poll data.
One would assume that this august group would want to see it. But in
their world, corruption is non-existent.
They believe that the Recorded Vote is identical to the True Vote.
AAPOR also claims that: “An exit poll sample is not
representative of the entire electorate until the survey is completed at the
end of the day. Different types of voters turn out at different times of the
day”.
But they don’t mention the fact that Kerry led the exit polls from
AAPOR parrots the Reluctant Bush Responder (rBr) myth used by exit pollsters Edison-Mitofsky: “In
recent national and state elections, Republicans have declined to fill out an
exit poll questionnaire at a higher rate than Democratic voters, producing a
slight Democratic skew”. But the 2004 Final Exit Poll indicated that
Bush 2000 voters comprised 43% of the 2004 electorate (which was mathematically
impossible) as opposed to 37% of Gore voters. And according to the E-M report, the highest
exit
poll refusal rates were in Democratic states. So much for
the rBr myth.
_____________________________________________________________________________________
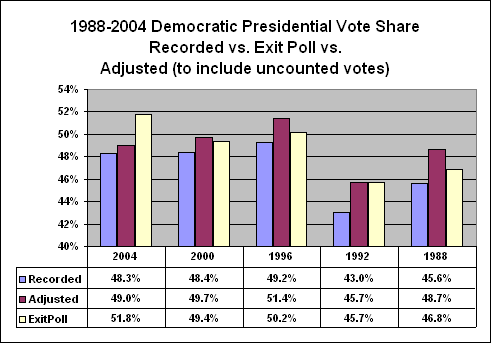
1988-2004: Uncounted Votes and Exit Poll discrepancies
Uncounted Votes have steadily declined as a percent of total votes cast - from 10.4% in 1988 to 2.7% in 2004. When added to the recorded vote in order to derive the total votes cast for the five elections from 1988-2004, the average Democratic unadjusted exit poll share is within 0.1% of the adjusted vote.
Comparing the adjusted vote to the aggregate exit poll and recorded vote (2-party exit poll in parenthesis):
Year
Democrat Recorded Exit
Poll Adjusted
Average
share 46.9% 48.8%
(52.7%) 48.9%
1988
Dukakis 45.6 46.8 (47.3) 48.7
1992
1996
2000
Gore 48.4 49.4
(51.4) 49.7
2004
Kerry 48.3 51.8
(52.3) 49.0
Look at this graph. In every one of the last five elections the unadjusted Democratic exit poll share exceeded the recorded vote. But which of the five stands out from the rest? The 2004 exit poll discrepancies were different in kind and scope from those of the prior four elections. Unlike 1988-2000, the 2004 discrepancies cannot be explained by uncounted votes alone.
There are some exit poll critics who claim that the large
(5.4 WPE) 1992 exit poll discrepancy proves that 2004 exit poll analysis (7.1
WPE) which indicate that the election was stolen are "crap" and
"bad science". After all, they say, there were no allegations of
fraud in 1992. They fail to mention (or are unaware of) the fact that in 1992
Clinton beat Bush I by a recorded 43.6-38.0m (43.0-37.4%) but 9.4m votes were
uncounted - and 70-80% were Democratic. When the uncounted votes are added, the
adjusted vote becomes 50.7-40.3m (45.7-36.4%), which exactly matched
From 1988-2000, after the uncounted adjustment, there was a 0.85% average Democratic exit poll discrepancy and 2.9 WPE. In 2004, after the 3.4m uncounted vote adjustment, there was a 2.8% discrepancy and Bush's margin was reduced from 3.0m (62.0-59.0) to 1.3m (62.9-61.6). But uncounted votes were only one component of Election Fraud 2004. The Election Calculator Model determined that approximately 5m votes were switched from Kerry to Bush.
Recorded and
Uncounted Votes
Recorded Dem Rep Other Dem Rep Other WPE Unctd Dem Rep
Avg 103.4 48.6 47.7 7.1 46.9% 46.0% 7.1% 3.76 7.5 5.6 1.9
2004 122.3 59.0 62.0 1.2 48.3% 50.7% 1.0% 7.09 3.4 2.6 0.9
2000 105.4 51.0 50.5 4.0 48.4% 47.9% 3.8% 2.01 5.4 4.0 1.3
1996 96.3 47.4 39.2 9.7 49.2% 40.7% 10.1% 1.93 8.7 6.5 2.2
1992 101.4 43.6 38.0 19.8 43.0% 37.4% 19.6% 5.40 9.4 7.0 2.3
1988 91.6 41.8 48.9 0.9 45.6% 53.4% 1.0% 2.38 10.6 7.9 2.6
Total Votes Cast vs.
Exit Poll
Adj. Votes Dem Rep Other Dem Rep Other EP Diff EP2pty Unctd
Avg 110.9 54.2 49.6 7.1 48.9% 44.6% 6.5% 48.8% 0.1% 52.7% 7.0%
2004 125.7 61.6 62.9 1.2 49.0% 50.0% 1.0% 51.8% -2.8% 52.3% 2.74%
2000 110.8 55.0 51.8 4.0 49.7% 46.8% 3.6% 49.4% 0.3% 51.4% 4.86%
1996 105.0 54.0 41.4 9.7 51.4% 39.4% 9.2% 50.2% 1.2% 55.8% 8.31%
1992 110.8 50.7 40.3 19.8 45.7% 36.4% 17.9% 45.7% 0.0% 56.8% 8.48%
1988 102.2 49.8 51.5 0.9 48.7% 50.4% 0.9% 46.8% 1.9% 47.3% 10.37%
_____________________________________________________________________________________
Projection and Post-election Models:
There are two basic methods used to forecast presidential elections:
1) Projections based on state and national polling trends which forecast the popular and electoral vote, updated frequently right up to the election.
2) Regression models based on historical time-series which forecast the popular vote, executed months before the election.
Polling models when adjusted for undecided voters and estimated turnout, are superior to regression models. Models which predicted a Bush win in 2000 and 2004 were technically "correct"; Bush won the recorded vote. But Gore and Kerry won the True vote. Except for the Election Calculator (below), all models assume that elections will be fraud-free.
Academics and political scientists create multiple regression models which utilize time-series data as relevant input variables: economic growth, inflation, job growth, interest rates, foreign policy, historical election vote shares, etc. Regression modeling is an interesting theoretical exercise but does not account for the daily events which affect voter psychology. Fraud could conceivably skew regression models and media tracking polls.
Statistical analyses provided by Internet bloggers concluded that BushCo stole the 2004 election. Their findings were dismissed by the media as "just another conspiracy theory" by the media right in Nov. 2004. A few of these “conspiracy fraudsters" were banned after posting on various liberal discussion forums. And even today, the most popular polling sites never discuss election fraud. But if the Democrats haven't raised the issue after two stolen elections, why should they expect the media to do it for them? Is there anyone who still truly believes that the elections were legitimate?
There has been much misinformation regarding electoral and popular vote win probability calculations. In the 2008 Election Model, the latest state poll shares are used to project the vote after adjusting for undecided voters. The model assumes the election is held on the day of the projection. The projections determine the probability of winning each state is used in simulating 5000 election trials. The expected electoral vote is a simple average; the probability of capturing at least 270 electoral votes is a simple ratio of the number of winning trials divided by 5000.
The probability of winning the popular vote is based on the aggregate state 2-party projected vote share and margin of error. These are input to the Excel normal distribution function. The probability (P) of winning the popular vote is P= NORMDIST (vote share, 0.50, MoE/1.96, True). The probability of winning the popular vote should be close to the probability of winning the electoral vote. In fact, if they are within a percentage point of each other, the state and national polls is a good test of the data and the methodology.
____________________________________________________________________________________
2004 Election Calculator True Vote Model
Based on 2000
recorded vote adjusted for voter mortality, uncounted votes and turnout in 2004
Vote shares based on
National Exit Poll (13047 respondents)
Kerry won by 53.2 - 45.4%
(66.9 - 57.1 million)
|
|
|
|
|
|
|
|
|
|
|
|
|
|
|
|
2000 Recorded |
|
|
|
|
|
|
2004 Calculated |
|
|
||
|
Voted |
Recorded |
Uncounted |
Cast |
Deaths |
Alive |
|
Turnout |
Voted |
Weight |
Kerry |
Bush |
Other |
|
|
|
|
|
|
|
|
DNV |
25.62 |
20.4% |
57% |
41% |
2% |
|
Gore |
51.00 |
4.04 |
55.04 |
2.72 |
52.32 |
|
95% |
49.70 |
39.5% |
91% |
8% |
1% |
|
Bush |
50.46 |
1.08 |
51.53 |
2.48 |
49.06 |
|
95% |
46.60 |
37.1% |
10% |
90% |
0% |
|
Nader/other |
3.96 |
0.27 |
4.23 |
0.21 |
4.02 |
|
95% |
3.82 |
3.0% |
64% |
17% |
19% |
|
|
|
|
|
|
|
|
|
|
|
|
|
|
|
Total |
105.42 |
5.38 |
110.80 |
5.41 |
105.39 |
|
100.13 |
125.74 |
100% |
53.23% |
45.39% |
1.38% |
|
|
|
|
|
|
|
|
|
|
125.74 |
66.94 |
57.07 |
1.74 |
|
|
|
|
|
|
|
|
|
|
|
|
||
|
|
|
Sensitivity Analysis |
|
|
|
|
Sensitivity Analysis |
|
||||
|
|
|
Kerry National Vote |
|
|
|
|
Kerry National Vote |
|
||||
|
Gore
share of |
|
|
|
|
|
|
Kerry
share of |
|
|
|
|
|
|
Uncounted
in 2000 |
Gore
Voter Turnout |
|
|
|
Gore
voters |
Share
of New voters (DNV in 2000) |
||||||
|
53.2% |
91.0% |
93.0% |
95.0% |
97.0% |
99.0% |
|
53.2% |
53.0% |
55.0% |
57.0% |
59.0% |
61.0% |
|
95.0% |
53.3% |
53.6% |
53.9% |
54.2% |
54.5% |
|
95.0% |
54.0% |
54.4% |
54.8% |
55.2% |
55.6% |
|
85.0% |
53.0% |
53.3% |
53.6% |
53.9% |
54.1% |
|
93.0% |
53.2% |
53.6% |
54.0% |
54.4% |
54.8% |
|
75.0% |
52.7% |
52.9% |
53.2% |
53.5% |
53.8% |
|
91.0% |
52.4% |
52.8% |
53.2% |
53.6% |
54.0% |
|
65.0% |
52.3% |
52.6% |
52.9% |
53.2% |
53.5% |
|
89.0% |
51.6% |
52.0% |
52.4% |
52.8% |
53.3% |
|
55.0% |
52.0% |
52.3% |
52.6% |
52.9% |
53.1% |
|
87.0% |
50.8% |
51.2% |
51.7% |
52.1% |
52.5% |
|
|
|
|
|
|
|
|
|
|
|
|
|
|
|
|
|
Kerry
Margin (millions) |
|
|
|
|
Kerry
Margin (millions) |
|
||||
|
|
|
|
|
|
|
|
|
|
|
|
|
|
|
9.87 |
91.0% |
93.0% |
95.0% |
97.0% |
99.0% |
|
9.87 |
53.0% |
55.0% |
57.0% |
59.0% |
61.0% |
|
95.0% |
10.1 |
10.8 |
11.5 |
12.3 |
13.0 |
|
95.0% |
11.8 |
12.8 |
13.8 |
14.9 |
15.9 |
|
85.0% |
9.2 |
10.0 |
10.7 |
11.4 |
12.2 |
|
93.0% |
9.8 |
10.8 |
11.9 |
12.9 |
13.9 |
|
75.0% |
8.4 |
9.1 |
9.9 |
10.6 |
11.3 |
|
91.0% |
7.8 |
8.8 |
9.9 |
10.9 |
11.9 |
|
65.0% |
7.6 |
8.3 |
9.0 |
9.8 |
10.5 |
|
89.0% |
5.8 |
6.9 |
7.9 |
8.9 |
9.9 |
|
55.0% |
6.8 |
7.5 |
8.2 |
8.9 |
9.6 |
|
87.0% |
3.8 |
4.9 |
5.9 |
6.9 |
7.9 |
|
|
|
|
|
|
|
|
|
|
|
|
|
|
|
|
|
|
|
|
|
|
|
|
|
|
|
|
|
|
|
|
|
|
|
|
|
|
|
|
|
|
|
|
|
Sensitivity Analysis |
|
|
|
|
Sensitivity Analysis |
|
||||
|
|
|
Kerry National Vote |
|
|
|
|
Kerry National Vote |
|
||||
|
Bush
2000 Voter |
|
|
|
|
|
Kerry
share of |
|
|
|
|
||
|
Turnout
in '04 |
|
Gore
Voter Turnout in '04 |
|
|
Gore
voters |
Share
of Bush voters |
|
|
||||
|
53.2% |
91.0% |
93.0% |
95.0% |
97.0% |
99.0% |
|
53.2% |
8.0% |
9.0% |
10.0% |
11.0% |
12.0% |
|
91.0% |
53.4% |
53.7% |
54.0% |
54.3% |
54.5% |
|
95.0% |
54.1% |
54.4% |
54.8% |
55.2% |
55.6% |
|
93.0% |
53.0% |
53.3% |
53.6% |
53.9% |
54.2% |
|
93.0% |
53.3% |
53.7% |
54.0% |
54.4% |
54.8% |
|
95.0% |
52.7% |
52.9% |
53.2% |
53.5% |
53.8% |
|
91.0% |
52.5% |
52.9% |
53.2% |
53.6% |
54.0% |
|
97.0% |
52.3% |
52.6% |
52.9% |
53.2% |
53.4% |
|
89.0% |
51.7% |
52.1% |
52.4% |
52.8% |
53.2% |
|
99.0% |
51.9% |
52.2% |
52.5% |
52.8% |
53.1% |
|
87.0% |
50.9% |
51.3% |
51.7% |
52.0% |
52.4% |
|
|
|
|
|
|
|
|
|
|
|
|
|
|
|
|
|
Kerry
Margin (millions) |
|
|
|
|
Kerry
Margin (millions) |
|
||||
|
|
|
|
|
|
|
|
|
|
|
|
|
|
|
9.87 |
91.0% |
93.0% |
95.0% |
97.0% |
99.0% |
|
9.87 |
8.0% |
9.0% |
10.0% |
11.0% |
12.0% |
|
91.0% |
10.3 |
11.0 |
11.7 |
12.5 |
13.2 |
|
95.0% |
12.0 |
12.9 |
13.8 |
14.8 |
15.7 |
|
93.0% |
9.4 |
10.1 |
10.8 |
11.5 |
12.3 |
|
93.0% |
10.0 |
10.9 |
11.9 |
12.8 |
13.7 |
|
95.0% |
8.4 |
9.1 |
9.9 |
10.6 |
11.3 |
|
91.0% |
8.0 |
8.9 |
9.9 |
10.8 |
11.7 |
|
97.0% |
7.5 |
8.2 |
8.9 |
9.6 |
10.4 |
|
89.0% |
6.0 |
6.9 |
7.9 |
8.8 |
9.7 |
|
99.0% |
6.5 |
7.3 |
8.0 |
8.7 |
9.4 |
|
87.0% |
4.0 |
5.0 |
5.9 |
6.8 |
7.8 |
|
|
|
|
|
|
|
|
|
|
|
|
|
|
_____________________________________________________________________________________
|
Implausible: Returning Gore voters required for
Bush’s 3.0m margin in 2004 Most likely scenario: 2000/2004 U.S. Vote Census estimates
and the Bush needed 21.5%
of returning Gore voters to match his recorded vote! Least likely scenario: Vote Census estimates and the Final
NEP “Voted 2000” shares (13660 respondents): Bush needed 18.1%
of returning Gore voters to match his recorded vote! |
|
||||||||||||||
|
|
|
||||||||||||||
|
Assumptions |
|
||||||||||||||
|
1.22% annual voter
mortality |
|
||||||||||||||
|
95% of 2000 voters
turned out to vote in 2004 |
|
||||||||||||||
|
|
|
||||||||||||||
|
Final NEP vote shares: |
|
||||||||||||||
|
Uncounted votes included
for 2000 and 2004: Bush required 18.1% of returning Gore Voters |
|
||||||||||||||
|
Uncounted votes not
included: Bush required 16.3% of returning Gore Voters |
|
||||||||||||||
|
|
|
||||||||||||||
|
|
|
||||||||||||||
|
Uncounted votes included for 2000 and 2004: Bush
required 21.5% of returning Gore Voters |
|
||||||||||||||
|
Uncounted votes not
included: Bush required 20.0% of returning Gore Voters |
|
||||||||||||||
|
|
|
||||||||||||||
|
|
|
|
|
|
|
|
|
|
|
|
|
|
|||
|
Final
NEP Voted 2000 shares |
|
|
|
|
|
|
|
||||||||
|
|
|
|
|
|
|
|
|
|
|
|
|
|
|||
|
3.45m
(2.74%) Uncounted in 2004, none in 2000 |
|
|
|
|
|
|
|
||||||||
|
|
2000 Recorded |
|
|
|
|
|
|
2004 Calculated |
|
||||||
|
Voted |
Recorded |
Uncounted |
Cast |
Deaths |
Alive |
|
Turnout |
Voted |
Weight |
Kerry |
Bush |
Other |
|||
|
|
|
|
|
|
|
|
DNV |
30.48 |
24.2% |
54.0% |
45% |
1% |
|||
|
Gore |
51.00 |
0.00 |
51.00 |
2.59 |
48.41 |
|
95% |
45.99 |
36.6% |
82.3% |
16.7% |
1% |
|||
|
Bush |
50.46 |
0.00 |
50.46 |
2.36 |
48.10 |
|
95% |
45.69 |
36.3% |
9% |
91% |
0% |
|||
|
Nader Other |
3.957 |
0.00 |
3.96 |
0.19 |
3.76 |
|
95% |
3.58 |
2.8% |
71% |
21% |
8% |
|||
|
|
|
|
|
|
|
|
|
|
|
|
|
|
|||
|
Total |
105.42 |
0.00 |
105.42 |
5.14 |
100.27 |
|
95.26 |
125.74 |
1.00 |
48.48% |
50.68% |
0.84% |
|||
|
|
|
|
|
|
|
|
|
|
125.74 |
60.96 |
63.73 |
1.05 |
|||
|
|
|
|
|
|
|
|
|
|
|
|
|
|
|||
|
No
uncounted votes in 2000 and 2004 |
|
|
|
|
|
|
|
|
|||||||
|
|
2000 Recorded |
|
|
|
|
|
|
2004 Calculated |
|
||||||
|
Voted |
Recorded |
Uncounted |
Cast |
Deaths |
Alive |
|
Turnout |
Voted |
Weight |
Kerry |
Bush |
Other |
|||
|
|
|
|
|
|
|
|
DNV |
27.03 |
22.1% |
54% |
45% |
1% |
|||
|
Gore |
51.00 |
0.00 |
51.00 |
2.59 |
48.41 |
|
95% |
45.99 |
37.6% |
82.7% |
16.3% |
1% |
|||
|
Bush |
50.46 |
0.00 |
50.46 |
2.36 |
48.10 |
|
95% |
45.69 |
37.4% |
9% |
91% |
0% |
|||
|
Other |
3.96 |
0.00 |
3.96 |
0.19 |
3.76 |
|
95% |
3.58 |
2.9% |
71% |
21% |
8% |
|||
|
|
|
|
|
|
|
|
|
|
|
|
|
|
|||
|
Total |
105.42 |
0.00 |
105.42 |
5.14 |
100.27 |
|
95.26 |
122.29 |
100% |
48.48% |
50.69% |
0.83% |
|||
|
|
|
|
|
|
|
|
|
|
122.29 |
59.28 |
61.99 |
1.02 |
|||
|
|
|
|
|
|
|
|
|
|
|
|
|
|
|||
|
5.4m
(4.86%) Uncounted in 2000, 3.45m (2.74%) in 2004 |
|
|
|
|
|
|
|||||||||
|
|
2000 Recorded |
|
|
|
|
|
|
2004 Calculated |
|
||||||
|
Voted |
Recorded |
Uncounted |
Cast |
Deaths |
Alive |
|
Turnout |
Voted |
Weight |
Kerry |
Bush |
Other |
|||
|
|
|
|
|
|
|
|
DNV |
25.61 |
20.4% |
54% |
45% |
1% |
|||
|
Gore |
51.00 |
4.04 |
55.04 |
2.72 |
52.32 |
|
95% |
49.70 |
39.5% |
80.9% |
18.1% |
1% |
|||
|
Bush |
50.46 |
1.08 |
51.53 |
2.48 |
49.06 |
|
95% |
46.60 |
37.1% |
9% |
91% |
0% |
|||
|
Nader/Other |
3.96 |
0.27 |
4.23 |
0.21 |
4.02 |
|
95% |
3.82 |
3.0% |
71% |
21% |
8% |
|||
|
|
|
|
|
|
|
|
|
|
|
|
|
|
|||
|
Total |
105.42 |
5.38 |
110.80 |
5.41 |
105.39 |
|
100.13 |
125.74 |
100% |
48.47% |
50.69% |
0.84% |
|||
|
|
|
|
|
|
|
|
|
|
125.74 |
60.95 |
63.73 |
1.06 |
|||
|
|
|
|
|
|
|
|
|
|
|
|
|
|
|||
|
5.4m
(4.86%) Uncounted in 2000, none in 2004 |
|
|
|
|
|
|
|
||||||||
|
|
|
|
|
|
|
|
|
|
|
|
|
|
|||
|
|
2000 Recorded |
|
|
|
|
|
|
2004 Calculated |
|
||||||
|
Voted |
Recorded |
Uncounted |
Cast |
Deaths |
Alive |
|
Turnout |
Voted |
Weight |
Kerry |
Bush |
Other |
|||
|
|
|
|
|
|
|
|
DNV |
22.17 |
18.1% |
54% |
45% |
1% |
|||
|
Gore |
51.00 |
4.04 |
55.04 |
2.72 |
52.32 |
|
95% |
49.70 |
40.6% |
81.3% |
17.7% |
1% |
|||
|
Bush |
50.46 |
1.08 |
51.53 |
2.48 |
49.06 |
|
95% |
46.60 |
38.1% |
9% |
91% |
0% |
|||
|
Nader/Other |
3.96 |
0.27 |
4.23 |
0.21 |
4.02 |
|
95% |
3.82 |
3.1% |
71% |
21% |
8% |
|||
|
|
|
|
|
|
|
|
|
|
|
|
|
|
|||
|
Total |
105.42 |
5.38 |
110.80 |
5.41 |
105.39 |
|
100.13 |
122.29 |
100% |
48.48% |
50.68% |
0.84% |
|||
|
|
|
|
|
|
|
|
|
|
122.29 |
59.29 |
61.98 |
1.02 |
|||
|
|
|
|
|
|
|
|
|
|
|
|
|
|
|||
|
|
|
|
|
|
|
|
|
||||||||
|
|
|
|
|
|
|
|
|
|
|
|
|
|
|||
|
5.4m
(4.86%) Uncounted in 2000, 3.45m (2.74%) in 2004 |
|
|
|
|
|
|
|||||||||
|
|
|
|
|
|
|
|
|
|
|
|
|
|
|||
|
|
2000 Recorded |
|
|
|
|
|
|
2004 Calculated |
|
||||||
|
Voted |
Recorded |
Uncounted |
Cast |
Deaths |
Alive |
|
Turnout |
Voted |
Weight |
Kerry |
Bush |
Other |
|||
|
|
|
|
|
|
|
|
DNV |
25.62 |
20.4% |
57% |
41% |
2% |
|||
|
Gore |
51.00 |
4.04 |
55.04 |
2.72 |
52.32 |
|
95% |
49.70 |
39.5% |
77.5% |
21.5% |
1% |
|||
|
Bush |
50.46 |
1.08 |
51.53 |
2.48 |
49.06 |
|
95% |
46.60 |
37.1% |
10% |
90% |
0% |
|||
|
Nader/other |
3.96 |
0.27 |
4.23 |
0.21 |
4.02 |
|
95% |
3.82 |
3.0% |
64% |
17% |
19% |
|||
|
|
|
|
|
|
|
|
|
|
|
|
|
|
|||
|
Total |
105.42 |
5.38 |
110.80 |
5.41 |
105.39 |
|
100.13 |
125.74 |
100% |
47.90% |
50.72% |
1.38% |
|||
|
|
|
|
|
|
|
|
|
|
125.74 |
60.23 |
63.78 |
1.74 |
|||
|
|
|
|
|
|
|
|
|
|
|
|
|
|
|||
|
No
uncounted votes in 2000 and 2004 |
|
|
|
|
|
|
|
|
|||||||
|
|
|
|
|
|
|
|
|
|
|
|
|
|
|||
|
|
2000 Recorded |
|
|
|
|
|
|
2004 Calculated |
|
||||||
|
Voted |
Recorded |
Uncounted |
Cast |
Deaths |
Alive |
|
Turnout |
Voted |
Weight |
Kerry |
Bush |
Other |
|||
|
|
|
|
|
|
|
|
DNV |
27.03 |
22.1% |
57% |
41% |
2% |
|||
|
Gore |
51.00 |
0.00 |
51.00 |
2.59 |
48.41 |
|
95% |
45.99 |
37.6% |
79.0% |
20.0% |
1% |
|||
|
Bush |
50.46 |
0.00 |
50.46 |
2.36 |
48.10 |
|
95% |
45.69 |
37.4% |
10% |
90% |
0% |
|||
|
Nader/other |
3.96 |
0.00 |
3.96 |
0.19 |
3.76 |
|
95% |
3.58 |
2.9% |
64% |
17% |
19% |
|||
|
|
|
|
|
|
|
|
|
|
|
|
|
|
|||
|
Total |
105.42 |
0.00 |
105.42 |
5.14 |
100.27 |
|
95.26 |
122.29 |
100% |
47.92% |
50.71% |
1.37% |
|||
|
|
|
|
|
|
|
|
|
|
122.29 |
58.60 |
62.01 |
1.68 |
|||
|
|
|
|
|
|
|
|
|
|
|
|
|
|
|||